Early Exploration of the High Latitude Stratosphere Part I: Pre-World War II Era
WRITTEN BY CMOS BULLETIN SCMO ON . POSTED IN ATMOSPHERE, PAST ISSUES, WHAT’S CURRENT.
– By Kevin Hamilton
Introduction
In 1960 McGill professor Ken Hare wrote a notable paper reviewing recent and ongoing research in stratospheric meteorology. In his paper Hare used example synoptic charts over North America (including the Canadian Arctic) to illustrate the basic features of the circulation in the lower and middle stratosphere. This paper came at the end of a period of fruitful discovery demonstrating that the winter stratosphere was a very dynamic environment and identifying the polar night jet stream and the sudden stratospheric warming phenomenon. Hare did not know of the equatorial quasibiennial oscillation (whose discovery was first published in 1961), but otherwise Hare’s paper describes what is still the modern paradigm for the stratospheric general circulation. Workers in the field of stratospheric dynamics would spend the next decades explaining and attempting to numerically simulate the key aspects of the circulation identified in Hare’s paper.
In a 1962 paper Hare put recent progress in context:
“Until 1950 it was generally assumed that the stratosphere was dull and uninteresting: it was dry and very stable with no weather […] The ascents that penetrated the tropopause confirmed this view. The winds were observed to decrease rapidly with height as the balloons climbed into the stratosphere…”
While this statement accurately emphasizes the rapid pace of discovery in the 1950’s, it oversimplifies the history. I have undertaken to delve deeper into the history of the scientific developments that led by about 1960 to the modern view of the extratropical stratospheric general circulation. This paper reviews some key developments up to about 1940, while Part II will examine the postwar investigations that led to the discovery and characterization of the “polar night jet stream” in the winter stratosphere.
Fig. 1 shows the DJF climatological zonal-mean temperature and zonal wind determined from modern observations plotted up to the 1 hPa (~50 km) level. The temperature plot includes blue shading for areas with temperatures below 210oK and red shading for regions in the stratosphere with temperature greater than 230oK.
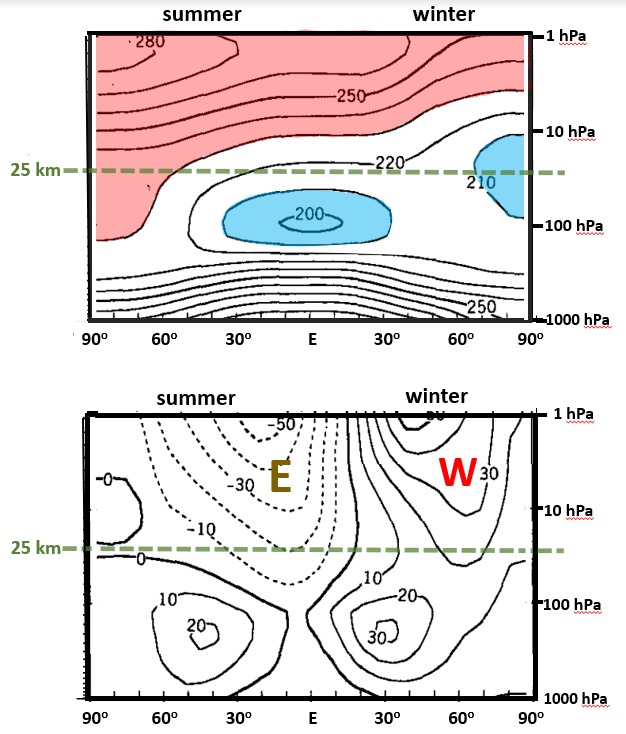
Figure 1. Multiyear average of the December-February mean zonal mean temperature (top) and zonal wind (bottom). Contours are labelled in oK and m-s-1, with dashed contours denoting easterly mean winds. Modified from Hamilton et al. (1995). Copyright American Meteorological Society. Used with permission.
The most notable feature of the lower stratosphere is the cold equatorial tropopause and temperatures that increase poleward along isobaric surfaces at least out to midlatitudes. The behavior of the lower stratosphere at high latitudes differs between the summer and winter hemispheres: in summer the temperature increases poleward all the way to the pole, while in winter the temperature reaches a maximum in midlatitudes and drops towards the very cold winter pole. This temperature structure is geostrophically consistent with the mean zonal winds seen in Fig. 1, with the wind speeds in the tropospheric jets dropping off above the tropopause in both hemispheres, but increasing again in a westerly polar stratospheric vortex in the winter and in an easterly polar vortex in the summer.
The Thermal Structure of the High-Latitude Stratosphere
Efforts to observe the atmospheric temperature above the surface using manned balloons began as early as the late 18th century. However, the systematic study of the atmosphere greatly advanced with the invention and deployment of unmanned balloon sondes beginning in the 1890’s, initially at some European locations. In 1902 Léon Teisserenc de Bort announced the discovery of a “zone isotherme” beginning between 8 and 12 km altitude in 25 soundings near Paris and similar results were announced for soundings near Berlin by Richard Assmann. Even after this first discovery of the tropopause the now-familiar features of the stratosphere, notably the enormous annual cycle in the circumpolar circulation from winter westerlies to summer easterlies were completely unknown and unanticipated by scientists.
Over the next two decades a more detailed picture emerged as unmanned soundings began to be taken at more locations. These early measurements were made with “registering sondes” which recorded the temperature, pressure and humidity on physical media, requiring that the sonde be recovered and returned to the investigator by members of the public. Overall this procedure worked surprisingly well and in some cases significant fractions of the sondes were returned. For example, the first such observations in Canada, at Toronto during 1911-1915, deployed 94 sondes, 53 of which were recovered (47 reached the stratosphere). By 1908 the fact that the tropical tropopause is much higher and colder than at higher latitudes had been discovered. This showed that, at least in a belt from the equator to midlatitudes, the temperature along a horizontal surface in the stratosphere increased poleward, a finding that was counter to the intuition based on the familiar behaviour of the atmosphere near ground. Still left open was the question of whether the temperature gradients continued all the way to the poles (in both winter and summer).
In 1927 the leading British meteorologist Sir William Napier Shaw published what seems to be the first attempt at a meridional-height climatology of atmospheric temperature, which he shows up to 20 km in “summer” and “winter”. His figure is somewhat startling to a modern meteorologist as it shows the temperature above the tropopause as exactly isothermal at each latitude and a temperature in the winter lower stratosphere that increases from about 60o latitude to the pole. Shaw’s result is reproduced here as Figure 2 with my own added labeling and color shading for clarity.
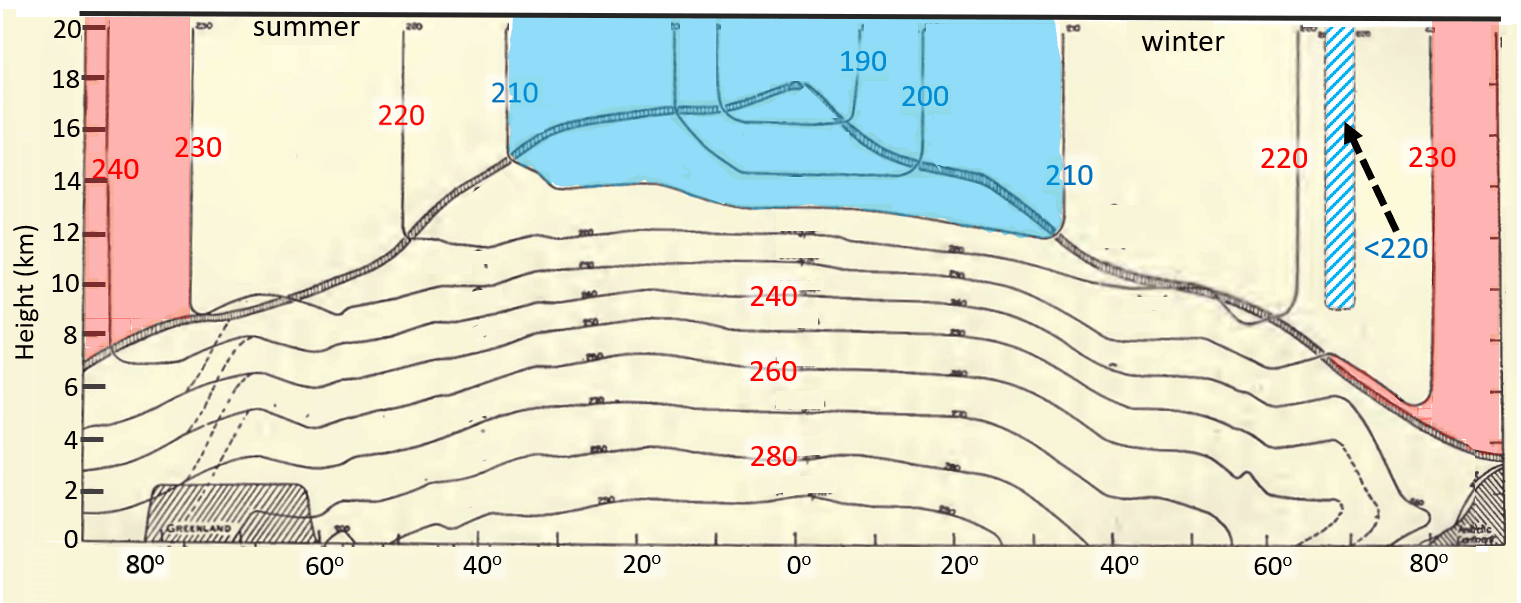
Figure 2. A cross-section of the near solstice temperature climatology, slightly modified from Shaw (1927). The red and blue continuous shading is as in Fig. 1. The striped blue shading denotes an isolated region with temperature below 220oK. The shaded regions near the ground show rough topographic representation of Greenland (left hemisphere) and Antarctica (right hemisphere). Despite the topography shown, there actually was no attempt by Shaw to distinguish the stratospheric temperature climatology in the Northern vs Southern hemispheres, and the temperature data used are mainly from the Northern Hemisphere.
Unfortunately, Shaw seems to have discounted credible, if indirect, evidence that the temperatures must rise substantially with height in the stratosphere. Shaw’s picture was soon criticized by Charles Normand, the Director-General of meteorological observatories in India, who noted that in the stratosphere Shaw had depicted “conditions that may be described as isothermal in the vertical.” Normand noted balloon measurements at low and midlatitude sites that suggested there is an actual inversion in the lower stratosphere, including measurements at his own observatory in Agra in India (27oN) which were then being analyzed by the young Indian meteorologist K.R. Ramanathan. In 1929 Ramanathan produced an improved temperature climatology extending to 25 km. His result is reproduced here in Figure 3. Ramanathan’s result compares much better with the modern climatology (Fig. 1). However, his depiction of the temperature climatology in the low stratosphere as being nearly symmetric between the summer and winter hemispheres stands out as an obvious deficiency.
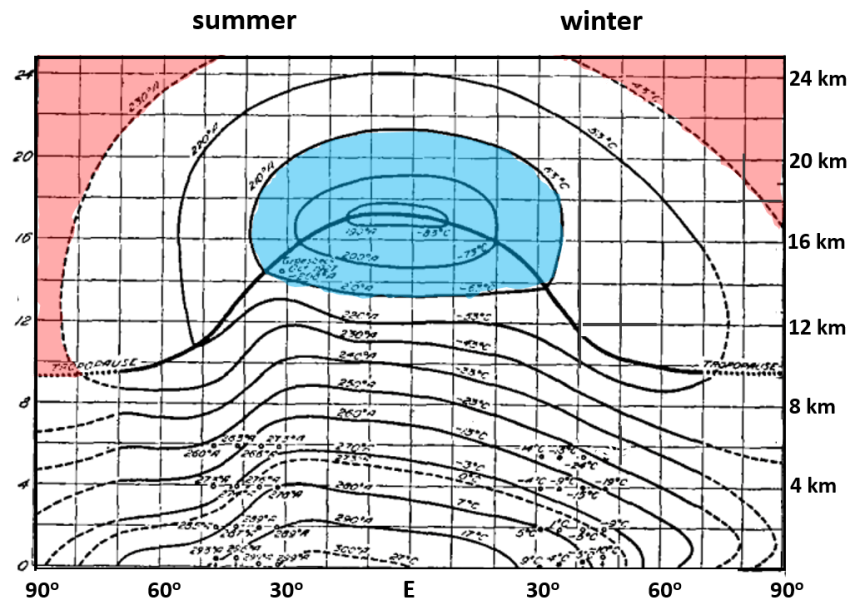
Figure 3. A cross-section of the near solstice temperature climatology as advanced by Ramanathan (1929). This figure is modified from a slightly derived version published in 1929 Monthly Weather Review. Red and blue shading as in Fig. 1.
These old diagrams of stratospheric climatology have something of the charm of antique world maps made when substantial imagination was still needed to complete the outlines of the continents. Ramanathan did not follow the custom of old mapmakers and depict dragons in his unknown polar regions, but contented himself with completely filling in his figure using dashed contours in the regions where he felt less confidence!
Both these early attempts by Shaw and Ramanathan completely missed the very cold winter pole and consequent increasing westerly flow with height in the circumpolar region that we now expect as the usual state of the high latitude winter stratosphere. Indeed Shaw was aware of the surprising implications of his temperature model for the stratospheric zonal wind, writing in 1928 that:
“above the level of 20 km we may expect a continuous gradient [of pressure] from the equator to the poles, increasing with height, and consequently a general circulation from East to West over the whole globe, […] equivalent to a lag of the atmosphere behind the rotation of the solid earth.”
The Need for More High Latitude Observations
Shaw responded very constructively to Normand and Ramanathan’s criticisms and wrote later in 1929:
“It is with much pleasure that I notice … Dr. Ramanathan’s amplification and correction of the tropical portion of my diagram of … temperature in a vertical section of the atmosphere of the globe from the summer pole to the winter pole. I hope the time is not far distant when some other enterprising meteorologist will render a like service for the polar regions of that diagram. It is badly needed.”
Here Shaw put his finger on the key remaining uncertainty for mapping the basic climatology of the lower stratosphere, namely whether in the winter and summer hemispheres the temperature continues to increase poleward. The lack of high latitude stratospheric observations is not surprising as the registering sonde approach was particularly challenging in remote regions. For example, a British team launched 450 registering sondes from Ft. Rae (modern
day Behchokǫ̀) in northern Canada (63oN, 110oW) during the 2nd International Polar Year (1932-33), but only 2 were recovered.
The 1930’s marked the beginning of a revolution in atmospheric monitoring with the development and deployment of radiosondes. After earlier pioneering experiments by American and French scientists, the first practical radiosonde had been invented by the Soviet meteorologist Pavel Molchanov in 1930. This enabled temperature data to be gathered as the balloon rose through the atmosphere and opened up a new vista for real time weather forecasting. The radiosonde technique was still experimental in the early 1930’s and, for example, it was not until 1937 that a network of operational radiosonde stations was established in the US. In Canada the first regular radiosonde profiling began in 1941 at Toronto and Edmonton, while daily radiosonde profiling in the Canadian north began at some stations starting in 1942.
In 1931 the exploration of the polar stratosphere took an important and colourful step forward with a unique scientific expedition that combined two cutting-edge technologies of the day: the newly-invented radiosonde and enormous dirigible airships capable of very long range flights, as described in the next section.
The Graf Zeppelin and the 1931 Polarfahrt (“Polar Journey”)
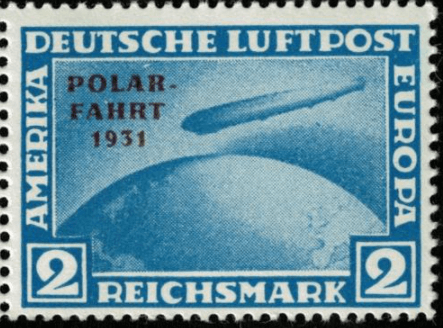
Figure 4. A German stamp issued to commemorate the 1931 polar expedition of the Graf Zeppelin.
The early 20th century was an era of polar exploration notable for famous land and sea expeditions aiming to reach the North and South Poles. Then the 1920’s saw polar explorations by fixed wing aircraft and dirigible balloons. At the end of the decade an international polar exploration society devised a plan to use the world’s largest dirigible airship – the 236 m long LZ127 Graf Zeppelin – for an Arctic journey of geographical discovery and scientific investigation. The key participants would be German, Soviet and US scientists and polar explorers. The Graf Zeppelin had been constructed in 1928 and normally was used for luxurious commercial passenger transportation. The costs of chartering the Graf Zeppelin and the other expenses of the Polarfahrt would be largely covered by the sale of franked postcards carried aboard that had stamps specially issued by the postal authorities of Germany and the Soviet Union (Figure 4). The flight was documented on film with newsreel style narration.
Notable among the scientists in the crew was Molchanov who brought his newly-invented radiosondes to profile the Arctic atmosphere from the dirigible platform.
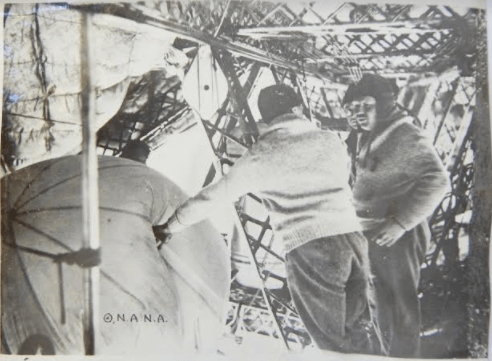
Figure 5. Pavel Molchanov and colleagues prepare to launch a sounding balloon from the Graf Zeppelin. Photo from the Radiosonde Museum of North America.
The flight began in Germany and stopped briefly in Lenningrad before lifting off on July 26, heading northward over the Barents Sea, passing 80oN and beyond the northern coast of the islands of Franz Josef Land. The Graf Zeppelin stayed aloft until July 30 when it landed in Berlin. For the aims of the Polarfahrt the dirigible had two notable advantages over fixed-wing aircraft: (i) it could move very slowly for long durations which greatly facilitated the mapping of the land and ocean surface below, and (ii) its large size and slow speed made it possible to serve as a platform to launch radiosonde balloons. The process was complicated because the cabins and other access points were on the bottom of the dirigible. The solution was to release the balloons with a weight that caused them to initially descend. After a short period the weight dropped off and the balloon could rise freely (see Figures 5 and 6). Molchanov made three successful soundings (near 66, 77.5 and 81oN) that penetrated the stratosphere up to ~16 km altitude. The temperature data collected in these soundings would get star billing in the next important paper on stratospheric climatology which I discuss below.
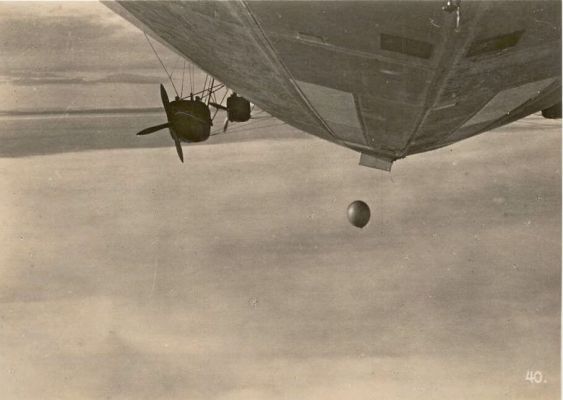
Figure 6. A sounding balloon dropped from the bottom of the Graf Zeppelin during the Polarfahrt expedition of 1931. The balloon was initially weighted and sank but the weight was designed to drop off, allowing the balloon to later rise. Photo from the Radiosonde Museum of North America.
The Climatology of Palmén (1934)
In 1934 Finnish meteorologist Erik Palmén reported on his new assessment of the temperature climatology in the stratosphere. Palmén’s paper in the Meterologische Zeitschrift is not currently available online (the full citation is reference #32 on this list). Below I will quote Palmén’s paper in my own machine assisted translation from the German.
Notably Palmén reviewed results of a successful multiyear series of registering balloon sondes at Abisko in northern Sweden (68oN) which he felt forced a complete revision of earlier ideas about the high latitude temperature in the stratosphere:
“With the temperature results of these registering balloons […] significant progress has been made in our knowledge of the temperature over the polar regions. There is no doubt that these new temperature data must essentially modify our view of stratospheric dynamics.”
Specifically he notes that a comparison of the Abisko observations in winter with observations from other European locations was consistent with stratospheric temperatures in winter decreasing poleward, rather than increasing “as was previously generally assumed”.
Palmén obtained confirmation of his contention of a cold winter polar region by obtaining
“…indirect evidence for the low stratospheric temperature in the Arctic by analyzing ascents in more southern regions during powerful intrusions of Arctic air masses”.
As an example he discussed a case in southern Norway (60oN) on February 2-3, 1933 and the analysis of:
“ … a series of six registration balloons sent […] to study the stratospheric processes in a deep cyclone whose center was already filled with Arctic air masses.”
And finding that
“the stratospheric temperature was conspicuously low, amounting to 207oK at the highest altitude observed (about 15.3 km).”
In summer, by contrast, Palmén found that the Abisko observations supported the idea of a warm pole, indeed
“…the polar-directed increase in temperature in summer is much more powerful than was previously believed”.
Palmén emphasized that this contention was supported by Molchanov’s Polarfahrt measurements:
“Further evidence of the extraordinarily high summer stratospheric temperature in the Arctic was provided by the soundings during the polar voyage of the Graf Zeppelin in July 1931.”
Specifically he quotes the temperatures measured by Molchanov’s three radiosondes at the highest point in each profile (all near 16 km altitude) 230oK, 234oK and 240oK at 66oN, 77.5oN and 81oN, respectively. Palmén speculated that the temperature increase would continue all the way to the pole so that:
“An average temperature of about 243oK 15 km above the North Pole therefore seems very likely for the months of June and July.”
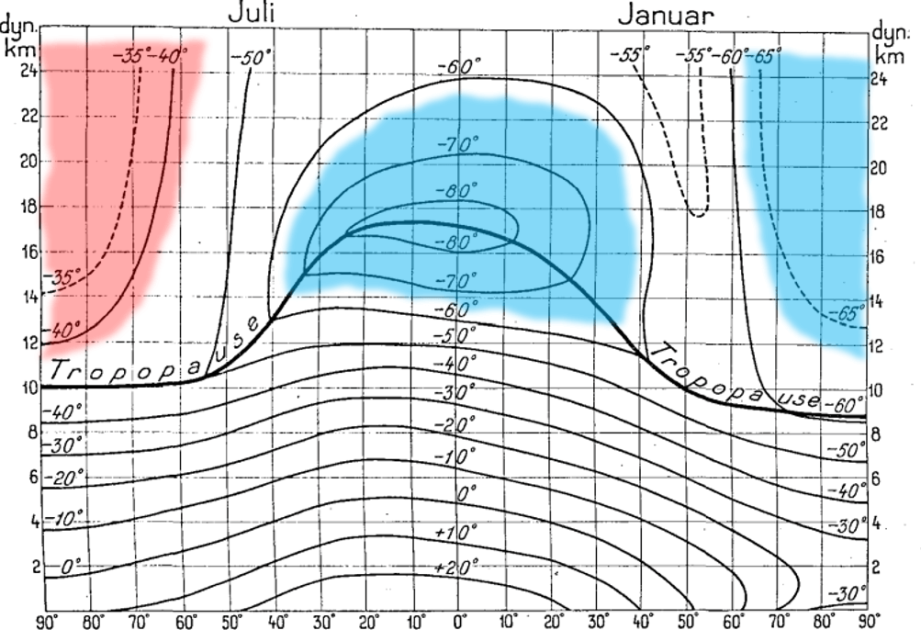
Figure 7. Palmén’s representation of the climatological temperature in the Northern Hemisphere in July (left half) and January (right half). The contours are labeled in oC. I have added blue and red shading with the same meaning as in earlier figures, but I subjectively estimated the locations of the 210oK (-63oC) and 230oK (-43oC) boundaries. Reproduced by permission, see www.borntraeger-cramer.de/journals/metz.
Palmén used his insights on the high latitude stratospheric temperature to construct a height-latitude section of temperature appropriate for the Northern Hemisphere in July and January (Figure 7). While the earlier climatology presented by Shaw shocks modern meteorologists by its unrealistic stratosphere, Fig. 7 is actually surprising in its rather realistic depiction of the stratospheric temperature structure.
Palmén’s work influenced a key contemporary work. The height-latitude climatology of the atmosphere was addressed in the landmark comprehensive (797 page) meteorology textbook Physikalische Hydrodynamik: Mit Anwendung auf die Dynamische Meteorologie (Physical Hydrodynamics Applied to Dynamical
Meteorology) published in 1933 by an all star group of authors including Vilhelm and Jacob Bjerknes and Tor Bergeron. They (figures 112 and 113) show February and August zonal mean temperatures for the Northern Hemisphere up to 17 km, but poleward of 60° only include results up to about 8 km. However in their discussion they write
“The polar stratosphere has been virtually unexplored so far, but based on the recently published preliminary communication on the results of the registration balloon ascents in Abisko, we can conclude that in summer the stratospheric temperature also continues to increase polewards from 60°N, while in winter it decreases again from 60°N.”
In 1937 the Japanese meteorologist Hidetaka Futi published a more complete climatology of stratospheric temperature. He shows diagrams with his best estimate of the climatological temperature for each calendar month, from the North Pole to 30°S (he used data from Pretoria at 26°S) and from the ground to 30 km altitude (although the actual observed soundings he used seem to have rarely extended above ~25 km). Futi’s results throughout the year are quite realistic compared with modern climatologies.
Conclusion
The results of Palmén and Futi represented a beginning step, but a very important step, towards understanding the dynamics of the stratosphere. Notably they identified the correct meridional temperature gradients in both the summer and winter hemispheres and thus proved that there should be a mean westerly stratospheric winter circumpolar vortex, definitively disproving Shaw’s model of mean easterlies at all latitudes. This set the scene for the more detailed understanding that would develop over the next two decades as determinations of the stratospheric winds became increasingly available – a story which I will relate in Part II.
Kevin Hamilton is Emeritus Professor of Atmospheric Sciences and retired Director of the International Pacific Research Center (IPRC) at the University of Hawaii. He has had a long career in academia and government including stints at McGill and the University of British Columbia in the 1980’s. His main research interests have been in stratospheric dynamics and climate modeling, but he has also investigated aspects of the history of meteorology. He currently serves as an Editor of the journal History of Geo- and Space Sciences.
