
The troposphere is expanding due to anthropogenic climate change
– By Jane Liu, Lingyun Meng, David W. Tarasick, William J. Randel, Andrea K. Steiner, Hallgeir Wilhelmsen, Lei Wang, Leopold Haimberger, and Wayne K. Hocking –
The tropopause is a transition between the troposphere and the stratosphere above it. Air temperature decreases with altitude from the surface to the tropopause because the surface is a heat source, while above the tropopause, air temperature increases with altitude because the ozone layer in the middle stratosphere is a second heat source. In other words, the tropopause is an altitude where temperature typically reaches a minimum. In some special cases, temperature decreases with altitude again above the tropopause, and then increases with altitude, forming a second tropopause. Rarely, a third tropopause can be formed. Here we only consider the first tropopause. Tropopause height (H) varies considerably in space and time. Generally, it is highest in the tropics, and decreases with latitude. It is also higher in warm seasons than in cold seasons. In the long term, temperature changes in the troposphere and stratosphere are two primary drivers for variation in tropopause height; i.e., tropopause height would stay the same if temperatures in the troposphere and stratosphere were stable. This appears to have been the case before the 1960s. Human activities have brought about substantial changes in tropospheric and in stratospheric temperatures. One factor is emissions of ozone depleting substances (ODSs) that deplete ozone in the stratosphere, causing temperature in the stratosphere to decrease. A second factor is emissions of greenhouse gases (GHG), which are conducive to both tropospheric warming and stratospheric cooling. Tropospheric warming and stratospheric cooling both tend to raise the tropopause. Following the implementation of the Montreal Protocol in the 1990s, depletion of stratospheric ozone was halted after the late 1990s. Stratospheric cooling has therefore subsided since the 2000s. In the troposphere, a temporary warming slowdown appeared in the early 2000s after the large El Niño of 1997–1998, termed the “global warming hiatus”. Previous studies agreed on increases in H over the period 1980–2000 but gave inconsistent projections of H trends after 2000, under the combined influence of GHG emissions and stratospheric ozone changes. Therefore, our research aims to address the following questions: (1) Does H continue to rise after 2000, with observed changes in stratospheric temperature (TSTR) and tropospheric temperature (TTRO)? at what rate? (2) How sensitive is H to changes in TSTR and TTRO? (3) What is the relative importance of changes in TSTR and TTRO to H? and (4) How do human activities cause changes in H?
Our analysis is based on dense radiosonde balloon observations, available from the Integrated Global Radiosonde Archive, as well as space-borne GPS radio occultation measurements and homogenized radiosonde data, i. e., RAOBCORE (Radiosonde Observation Correction Using Reanalyses) and RICH (Radiosonde Innovation Composite Homogenization). Specifically, we used radiosonde balloon observations over the Northern Hemisphere (NH), mostly over land, between 20°N and 80°N from 1980 to 2020. We selected 149 stations according to the length and completeness of the sounding records over 1980–2020 at these stations. We linearly interpolated each of the original radiosonde profiles to a unified 200-m vertical resolution. Then, we determined H for each profile following the WMO tropopause definition. For each profile, TSTR is calculated as the mean of temperatures at 100 and 70 hPa, while TTRO is represented by the mean of temperatures at 850, 700, 500, 400, and 300 hPa. H, TTRO, and TSTR are all modulated by natural variability, mainly volcanic eruptions, ENSO (El Niño–Southern Oscillation), and the QBO (quasi–biennial oscillation). We removed these three types of natural variability in the original time series of H, TTRO, and TSTR by multiple linear regression models. In this way, the impact of anthropogenic activities on the variation in the tropopause can be isolated. As long-term trends are calculated from monthly anomalies, the seasonal variations in all the time series are removed as well.
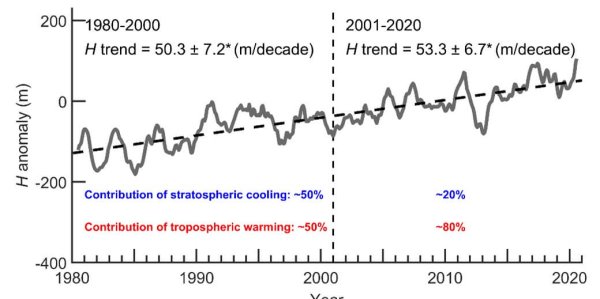
Figure 1 shows anomalies in H (H minus its mean over 2001-2020), with natural variability removed, from 1980-2020. We can observe a rise in tropopause height of 200-250 meters in the NH over 1980-2020. The tropopause rises before and after 2000 essentially at the same rate of 50-60 meters per decade; that is, the difference is not statistically significant.
To assess the relative importance of TTRO, and TSTR to variation in H, we developed a novel and robust statistical method that quantifies the sensitivity of tropopause height to changes in TTRO, and TSTR. Using the large radiosonde database of 149 stations over four decades, we find that changes in H are more closely correlated to changes in TTRO (correlation coefficient r=0.430.25, significant at the 95% confidence level) than changes in TSTR (r=-0.320.19, significant at the 95% confidence level). Specifically, H increases ~170 meters if TTRO increases by 1 degree Celsius or 1 K, and increases ~70 meters if TSTR decreases by 1 degree Celsius. We also constructed time series of temperature at different layers (Figure 2). Taking the mean of temperature at 850, 700, 500, 400, and 300 hPa, we find the trend of TTRO over 1980-2000 to be 0.17 ± 0.03 K per decade. The warming trend of TTRO increases significantly to 0.31 ± 0.02 K per decade over 2001-2020. Similarly, taking the mean of temperature at 100 and 70 hPa, the cooling trend of TSTR after 2000 declines to 0.14 ± 0.04 K per decade from 0.58 ± 0.05 K per decade in the earlier period. Factoring the trends of TTRO and TSTR before and after 2000 with the sensitivity of H to the changes in TTRO, and TSTR, we estimate that after 2000, tropospheric warming plays a dominant role (~80%) in raising the tropopause, while before 2000, tropospheric warming and stratospheric cooling contribute almost equally to tropopause rise (Figure 1). This further explains why the rate of the tropopause rise before and after 2000 is comparable between the two sub-periods: the effect of stratospheric cooling on rising H is reduced after 2000, but this is compensated by the enhanced effect of tropospheric warming.
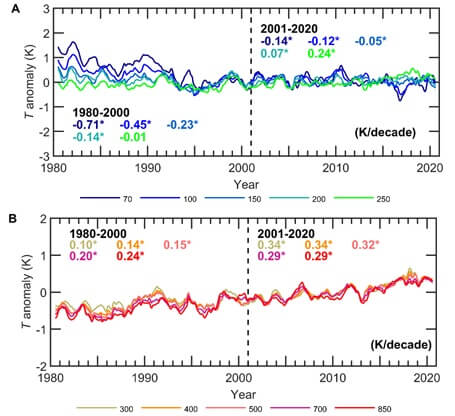
Figure 2 provides a detailed evaluation of temperature at 10 pressure levels from 850 hPa to 70 hPa. For clarity, the time series of temperature are shown in separate figures. Figure 2A includes two levels (100 hPa and 70 hPa) for calculating TSTR and three additional levels, while Figure 2B covers all the pressure levels used for calculating TTRO. Over the earlier period, temperature trends below 300 hPa are all positive, largest at 850 hPa (0.25 K per decade), indicating strongest warming rate near the surface. Above the 250 hPa level, temperature trends become more and more negative, most negative at 70 hPa (-0.71 K per decade), indicating strong cooling in the middle stratosphere. After 2000, the largest warming trend also appears at 850 hPa. Most importantly, warming is intensified throughout the troposphere. The turning point where positive trends switch to negative trends appears at 150 hPa, a higher level than in the earlier period. Meanwhile, lower stratospheric cooling is much slower.
Other available observational data, including GPS RO, RAOBCORE and RICH (not shown), all support these conclusions: tropospheric temperature after 2000 has increased at a rate faster than before 2000, making tropospheric warming a major driver for tropopause rise after 2000 in the NH. This is consistent with the notion that global warming has become more rapid in recent decades. Furthermore, the original time series (not shown) give similar results, but larger trends; ~80% of the increasing trend remains after the natural-variability related effect is removed. We infer that about 80% of the tropopause rise can be related to human activities, especially the fossil fuel consumption that is the primary cause of global warming in recent decades. Thus changes in H provide a valuable indicator of anthropogenic climate change. Fossil fuel consumption is leaving its fingerprints, not only on the planet’s surface with sea level rise and retreating glaciers, but also high up, at 8-15 km at the tropopause.
Because the tropopause is an important dynamical feature of the atmosphere, tropopause rise may have long term impacts on our climate and weather. In the troposphere, high-level clouds shift to higher altitudes globally as the tropopause becomes higher. The rise of the tropopause may affect stratosphere-troposphere exchange (STE), especially over the Tibetan Plateau, where STE in winter is significantly enhanced because of the combined effects of a rising tropopause, strengthened westerlies, and weakened plateau winter monsoons. Simulations indicate that tropopause rise is the main contributor to an enhanced and poleward shift of mid-latitude zonal jets in the troposphere. In the stratosphere, the Brewer-Dobson circulation (BDC) is strengthening, accompanied with tropopause rise. As our understanding of the impact of rising tropopause on climate and weather is rather limited, further studies are warranted.
Dr. Jane Liu is an associate professor in the Department of Geography and Planning, University of Toronto. She received her PhD. in atmospheric science from the Department of Physics of the same university. Her research interests include air pollution, climate change, satellite remote sensing of atmosphere and land, and carbon and water cycles. She publications are available from Google Scholar. She can be contacted at janejj.liu@utoronto.ca.