
Particulate Matter: A Milton Case Study
Introduction
Particulate matter (PM), including PM1, PM2.5, and PM10, represents a risk to human health at elevated levels. Xu et al. suggest that PM concentrations can vary greatly due to meteorological conditions such as wind speed, wind direction, and temperature (Xu et al., 2020). Though studies surrounding the influence of meteorological factors surrounding PM concentration have been extensively performed in various countries in Asia where PM concentrations are much higher compared to North America, such investigations, at least in the literature, have yet to include cities in Canada. As such, given Canada’s target of welcoming 500,000 immigrants on an annual basis (Immigration, 2024), this increase in population will undoubtedly lead to greater road traffic and construction. Hence, to understand the influence of meteorological conditions on PM in a growing GTHA (Greater Toronto Hamilton Area) suburb, Milton was chosen as the location for the study as the city represents one of the fastest-growing cities in all of Ontario (Government of Canada, 2022). In the study, we used air quality sensors from Air Gradient which has been shown in studies to accurately capture data at 99% accuracy of industry-standard PM monitoring stations. The sensors from Air Gradient were used as outdoor air quality sensors, and to best capture the range of PM values in the city, the sensors were placed outside family homes at the two locations: The North end and South end of Milton, both next to main roads (Main Street and Thompson Road), high schools, and construction sites. Being located near main roads, the sensors were placed by major roadways and construction sites, prime areas for elevated PM levels, to understand the level of exposure experienced by the residents living on the main arteries. In the study, we studied the influence of wind direction, wind speed, and temperature on PM1, PM2.5, and PM10 values. The meteorological data was taken from the Environment Canada site for Toronto’s Pearson airport. The values from our outside PM sensors, for both North and South locations, were compared to the Milton PM2.5 monitoring station (from the Ministry of Environment of Ontario) to understand how extensive a difference existed between the measurements.
Data Collection
We collected data from April 28, 2024, to May 23, 2024. PM Concentrations were collected using sensors provided by the company Air Gradient which is situated in Thailand. These sensors were placed at both locations and recorded data every minute. The Air Gradient app transmitted raw data of multiple PM Concentrations and other measures in real-time. This data then was exported to Microsoft Excel to model the data, visualize the trends, and perform preliminary analyses.
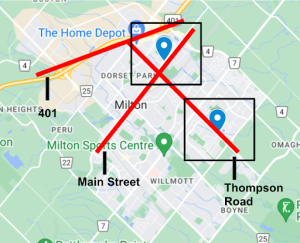
Figure 1 shows the approximate locations where we deployed the sensors. The blue placemarks show the approximate location where we placed the sensors. With regards to the North location, the house is surrounded on all three sides by main roads: Main Street, Thompson Road, and Highway 401 (the busiest highway in the world). Plus, the nearby construction of an apartment building (less than 100 meters away) further contributed to the PM concentration. In contrast, for the South location, the primary PM contributors were road traffic along Thompson Road as well as the construction of an apartment building and a secondary school within 100 meters of the residence. The location of our sensors along busy roads and construction areas helps to capture PM concentrations in a situation of rapid urban growth.
Results
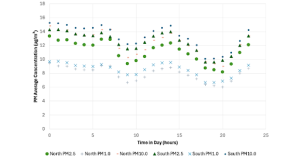
In terms of times in the day with the highest PM concentration, as expected, the times between 12:00 – 3:00 pm contributed to the highest PM 2.5 – Figure 2.
This observed peak in PM levels is linked to commuting and construction activity peaking during the afternoon The data points in Figure 2 were calculated by averaging hourly values across the course of the study; they represent average PM concentrations for each hour of the day. Interestingly, we also noticed relatively high PM values in the night as well, which we attributed to the nocturnal boundary layer. PM is trapped near the ground, contributing to higher concentrations at night and early morning. During the day, the sun heating the surface causes thermal plumes and mixing. Whereas, at night, the atmosphere is much calmer, reducing mixing and causing pollutants to get trapped near the surface. The nocturnal boundary layer is most prevalent during the early morning time period, which we can see between 7 – 10 am. Essentially, the PM that accumulated during the day, especially late afternoon, remained concentrated in the lower atmosphere, thus contributing to elevated PM2.5 levels also at night. We also compared the daily PM2.5 averages against the maximum daily PM2.5 average target of 15 µg/m3 set out by the World Health Organization (WHO, 2021) – Figure 3.
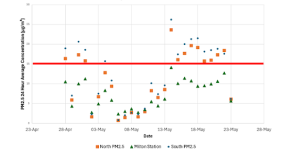
We saw that for the South location, the daily average for PM2.5 exceeded the WHO’s limits around 60% of the time, with the highest daily average being recorded on May 16, at 26 µg/m3, nearly double the WHO’s target. On the other hand, for the North location, 52% of the daily average for outdoor PM2.5 measurements exceeded the WHO’s guidelines. Similar to the South location, North Milton experienced the highest PM2.5 daily average on May 16, with a 24-hour average of 23 µg/m3. Interestingly, the Milton PM2.5 monitoring station, funded by both the Provincial and Federal governments, never experienced a daily average PM2.5 measurement above 15 µg/m3. This result is expected because the PM2.5 monitoring site is located away from the main roads and construction sites, thus, predictably, leading to lower levels of PM2.5. The benefit of having PM2.5 sensors in different locations of Milton, especially near known PM sources, is the ability to view the localization of PM in certain neighborhoods, especially around main roads.
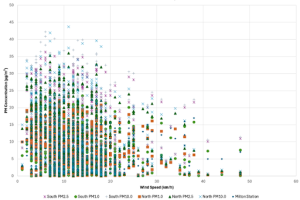
In relation to the meteorological influence on PM levels, lower wind speeds result in high PM values, while higher wind speeds result in lower PM values. Once again, the wind speed data was collected from the Environment Canada’s website for Toronto’s Pearson airport. High wind speeds, exceeding 25 km/h, begin to elicit a decline in PM concentration. However, as the two-story residential homes and the Green Belt often block Milton from high wind speeds exceeding 40 km/h, high wind speeds can rarely make a meaningful contribution to decreasing PM values. Nevertheless, high wind speeds, as expected, help reduce PM concentration.
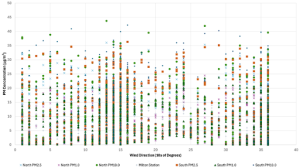
For wind direction, interestingly, no significant difference was observed in the change in direction affecting PM concentration – Figure 5. This, we believe, can be attributed to pollution sources being all around the sample sites including construction, road traffic, and highway traffic for both the North and South locations.
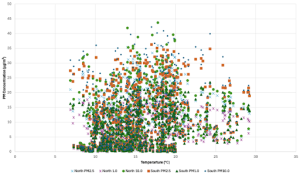
The temperature also does not significantly impact PM concentration – Figure 6. Since we sampled during the spring when the average difference in temperature in the morning and night was around 10 degrees, the impact of temperature on PM2.5 was not as significant.
Conclusion
Ultimately, the goal of the study was to understand the influence of meteorological conditions on PM in one of Canada’s fastest-growing suburbs. As expected, we noticed outdoor PM levels to be the highest between 12:00 – 3:00 pm. No significant changes were seen in PM concentration with wind direction and temperature. Only, wind speed at very high speeds at around 50 km/h, resulted in a significant decrease in PM concentration. Importantly, we noticed that the PM2.5 daily average across all sample sites had daily average PM2.5 concentrations exceeding the 15 µg/m3 WHO limit, which we attributed to construction dust and car emissions as sensors were placed near construction areas and busy roadways. The high concentration of PM particles shows that even in Western countries, including Canada, with strong air quality regulations, PM concentrations can exceed WHO guidelines.
We are a team of high school students studying PM2.5 levels across Milton, Ontario. We have a shared interest in health and environmental sciences, and currently, we are working on an air quality research project to understand how environmental factors impact PM concentration.
References
Immigration, R. and C. C. (2024, March 6). CIMM – Immigration Levels Plan for 2024-2026 – November 07, 2023. Www.canada.ca. https://www.canada.ca/en/immigration-refugees-citizenship/corporate/transparency/committees/cimm-nov-07-2023/immigration-levels-plan-2024-2026.html
Government of Canada, S. C. (2022). Canada’s fastest growing and decreasing municipalities from 2016 to 2021. Www12.Statcan.gc.ca. https://www12.statcan.gc.ca/census-recensement/2021/as-sa/98-200-x/2021001/98-200-x2021001-eng.cfm
WHO. (2021). WHO global air quality guidelines. Geneva Who.
Xu, Y., Xue, W., Lei, Y., Huang, Q., Zhao, Y., Cheng, S., Ren, Z., & Wang, J. (2019). Spatiotemporal variation in the impact of meteorological conditions on PM2.5 pollution in China from 2000 to 2017. Atmospheric Environment, 117215. https://doi.org/10.1016/j.atmosenv.2019.117215