
Satellite SSS : A Monitoring Tool for the Gulf of St. Lawrence?
– By Jacqueline Dumas, Julien Laliberté, and Denis Gilbert –
The use of satellite remote sensing technology to monitor the Gulf of St. Lawrence was first demonstrated in 1961 when TIROS-2 captured the spring ice breakup. Following this breakthrough, satellites were used increasingly to improve our understanding of ocean dynamics. In fact, satellite data have been used for half a century to monitor sea surface temperature (Minnett et al. 2019) and for over forty years to monitor ocean color (McClain et al. 2022). In addition, Sea surface salinity (SSS) satellite-based products have recently been developed to depict ocean dynamics. The available satellite data include European Space Agency’s Soil Moisture Ocean Salinity (SMOS) products since 2010 and National Aeronautics and Space Administration’s Soil Moisture Active Passive (SMAP) products since 2015. Numerous studies have used these data sets to capture SSS signals throughout the world including in the Arabian Sea (Menezes, 2020), the Bay of Bengal (Akhil et al, 2020), the Mediterranean Sea (Grodsky et al, 2019) the Indonesian Sea (Lee et al 2019), the Gulf of Mexico (Vasquez-Cuervo et al 2018) as all well as colder regions such as the Arctic ocean (Fournier et al 2019) and the Gulf of Maine (Grodksy et al. 2018). This last study also includes a promising evaluation of satellite SSS for monitoring the Gulf of Maine.
The algorithms to retrieve the satellite SSS vary amongst products, using various ancillary inputs such as wind speed and direction, sea ice masks, galactic maps and dielectric constant models. Each product also uses different correction schemes and different approaches to estimating the uncertainty in their data. Generally, satellite SSS use the sea surface temperature and brightness temperature to attribute a value to sea surface salinity. In proximity to land, radio frequency interference can lead to errors in satellite measurements. Most products omit data close to land for this reason.
The Gulf of St. Lawrence (GSL) is a dynamic semi-enclosed marine system for which salinity is closely monitored with in situ sampling programs overseen by the Department of Fisheries and Oceans Canada such as the Atlantic Zone Monitoring Program (AZMP). Since in situ sampling is punctual in space and time, Dumas and Gilbert (2023) recently sought to verify how synoptic observations of SSS satellite products could help complete our understanding of the GSL surface salinity. They compared two products from SMOS; Centre Aval de Traitement des Données SMOS (CATDS) and Barcelona Expert Center (BEC), as well as two products from SMAP; Jet Propulsion Laboratory (JPL) and Remote Sensing Systems (RSS). The spatial resolution of these smoothed Level 3 products is approximately 60 km. They are available as monthly means or as 8 and 9-day running means for SMAP and SMOS, respectively. These four satellite products were evaluated by comparing them with in situ CTD measurements taken throughout the GSL at 2 m depth or less from the ocean surface. The satellite products were also compared to a moored CTD at 1 m depth located 40 km from the coast at the AZMP Shediac Valley Station, shown in Figure 1.
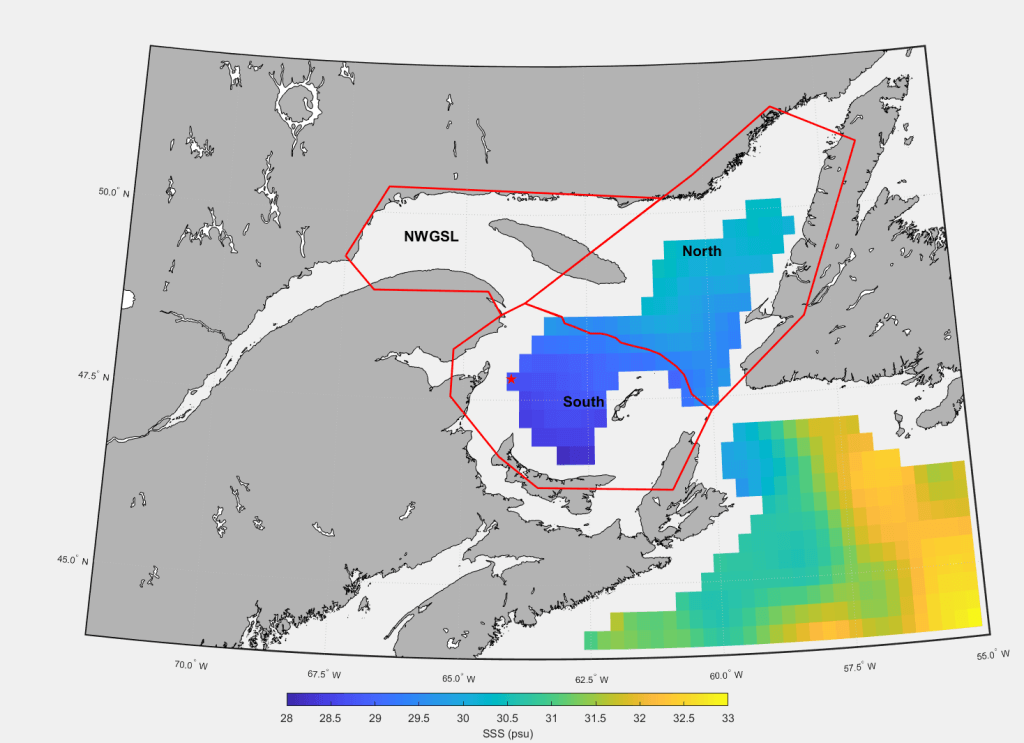
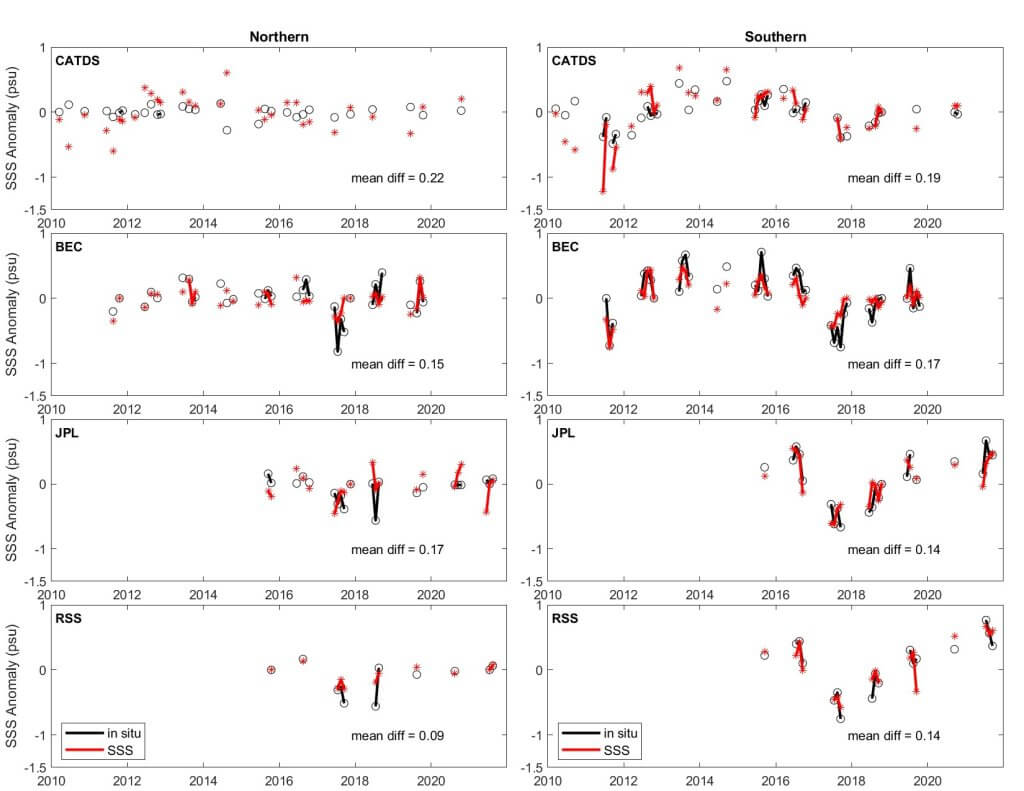
Comparing monthly means of satellite and in situ SSS for each of the four satellite products resulted in statistically significant correlations which explained 71-81% of the variance over the whole GSL region. Three different subregions were defined (Southern GSL, Northern GSL and northwest GSL in Figure 1) due to different salinity patterns and sampling frequency. The Southern GSL had the most CTD observations, the greatest seasonal variability and the greatest variance explained (64-72%) of the three regions. JPL had the highest variance explained in this region, followed by BEC, CATDS and RSS. In the Northern region 49-59% of the variance was explained by JPL, BEC and RSS, whereas in the NWGSL region 52-56% of the variance was explained by CATDS and BEC. Note that only SMOS products had data available in the NWGSL region. More in situ CTD data will be required to confirm if the stronger variance explained in the South region is due to better data availability there. Time series of the anomaly of regional monthly means show good agreement between the interannually varying in situ and satellite SSS (Figure 2).
When comparing satellite measurements to CTD SSS at one grid point, the Shediac Valley high frequency sampling station, 48-92% of the variance was explained. At this location BEC had lower correlation coefficients than other products. 77-88% of variance in SSS was explained by JPL and 83-92% by CATDS. The mean bias for different regions is approximately 0.5 psu and 0.3 psu when evaluated at the Shediac Valley grid point.
The study concludes that, although the GSL waters are relatively cold (which poses an extra challenge to SSS retrieval) and close to land and ice, satellite data successfully capture SSS its interannual variability and annual cycle. More specifically, the study concluded that based on data availability and correlation coefficients, JPL stood out as being the best satellite product for this region.
Keeping in mind that the objective of this evaluation was to supplement the availability of salinity measurements with other sources of information, other means of deriving salinity should be considered next. For instance, a relation between ocean color and salinity is well established in the scientific literature. Colored dissolved organic matter (CDOM) generally decreases as salinity increases and, since CDOM absorbs blue sunlight, it can be monitored by ocean color satellites. Thus CDOM can be used as a proxy for salinity. A quantitative evaluation of this relationship for the GSL is already detailed in Nieke et al. (1997) and ready to be implemented along the salinity gradient. The higher spatiotemporal resolution of ocean color satellite data (typically 4 km, daily) would add considerable information about salinity to the GSL in general, but perhaps most importantly in regions not covered by SMOS and SMAP products.
Jacqueline Dumas completed her M.Sc. in Earth and Ocean Sciences at the University of Victoria, BC. Her thesis and earlier work focused on the impact of varying atmospheric forcing on the thickness of Arctic sea ice using a thermodynamic sea ice model. Presently working at Maurice Lamontagne Institute, QC, she has worked on projects involving oxygen and salinity observations and more recently she has joined the biogeochemical modelling group. She also looks after the permanent thermograph network in the GSL.
Dr. Julien Laliberté works for the Department of Fisheries and Oceans Canada where he seeks to reinforce our knowledge on phytoplankton in the Estuary and Gulf of St. Lawrence. He monitors the ecosystem using ocean color remote sensing, fieldwork, and hydrological optics.
Dr. Denis Gilbert worked as a physical oceanography research scientist for the Department of Fisheries and Oceans Canada from 1991 to 2021. He created his own company (Denis Gilbert Scientifik) in 2022 to offer science communication and climate services. Twitter handel : @dgscientifik
Bibliography
Akhil, V. P., Vialard, J., Lengaigne, M., Keerthi, M. G., Boutin, J., Vergely, J. L., & Papa, F. (2020). Bay of Bengal sea surface salinity variability using a decade of improved SMOS re-processing. Remote Sensing of Environment, 248(111964), 1–18. https://doi.org/10.1016/j.rse.2020.111964
Dumas, J., Gilbert, D. (2022): Comparison of SMOS, SMAP and In Situ Sea Surface Salinity in the Gulf of St. Lawrence, Atmosphere-Ocean, DOI: 10.1080/07055900.2022.2155103
Fournier, S., Lee, T., Tang, W., Steele, M., & Olmedo, E. (2019). Evaluation and intercomparison of SMOS, aquarius and SMAP sea surface salinity products in the Arctic ocean. Remote Sensing, 11(24), 1–19. https://doi.org/10.3390/rs11243043
Grodsky, S., Vandemark, D., & Feng, H. (2018). Assessing coastal SMAP surface salinity accuracy and its application to monitoring gulf of maine circulation dynamics. Remote Sensing, 10(8), 1–19. https://doi.org/10.3390/rs10081232
Grodsky, S. A., Reul, N., Bentamy, A., Vandemark, D., & Guimbard, S. (2019). Eastern Mediterranean salinification observed in satellite salinity from SMAP mission. Journal of Marine Systems, 198(103190) 1–11. https://doi.org/10.1016/j.jmarsys.2019.103190
Lee, T.,Gordon, S.,&Sprintall, J. (2019). Maritime continent water cycle regulates low-latitude chokepoint of global ocean circulation. Nature Communications, 10(2103), 1–13. https://doi.org/10.1038/s41467-019-10109-z
McClain C.R., Franz B.A. and Werdell P.J. (2022) Genesis and Evolution of NASA’s Satellite Ocean Color Program. Front. Remote Sens. 3:938006. doi: 10.3389/frsen.2022.938006
Menezes, V. (2020). Statistical assessment of sea-surface salinity from SMAP: Arabian Sea, Bay of Bengal and a promising Red Sea application. Remote Sensing, 12(3), 1–37. https://doi.org/10.3390/rs12030447
Minnett, P. J., Alvera-Azcárate, A., Chin, T. M., Corlett, G. K., Gentemann, C. L., Karagali, I., … & Vazquez-Cuervo, J. (2019). Half a century of satellite remote sensing of sea-surface temperature. Remote Sensing of Environment, 233, 111366.
NASA, “SSS Retrieval – It’s Complicated’’, Salinity: Sea Surface Salinity from Space, https://salinity.oceansciences.org/data-salinity-02.htm. Accessed 22 January 2023.
Nieke, B., Reuter, R., Heuermann, R., Wang, H., Babin, M., & Therriault, J. C. (1997). Light absorption and fluorescence properties of chromophoric dissolved organic matter (CDOM), in the St. Lawrence Estuary (Case 2 waters). Continental Shelf Research, 17(3), 235-252.
Vazquez-Cuervo, J., Fournier, S, Dzwonkowski, B., & Reager, J. (2018). Intercomparison of in-situ and remote sensing salinity products in the Gulf of Mexico, a river-influenced system. Remote Sensing, 10(10), 1590. https:/doi.org/10.3390/rs10101590
denis gilbert, gulf of st. lawrence, jacqueline dumas, Julien Laliberté, remote sensing, satellites, sea surface salinity