
Visibility Forecast in Wildfire Smoke: An August 2018 Case Study
– By Yimei Li, Canadian Meteorological Aviation Centre, Environment and Climate Change Canada –
In recent years, wildfire smoke has become an increasingly alarming natural disaster in Western Canada. In 2017 and 2018, the British Columbia provincial government declared a state of emergency for two consecutive summers in response to the wildfire situation (1). These were the third and fourth declarations in history and the previous ones were in 1996 and 2003. The duration of the declarations were from July 7, 2017 to September 15, 2017 and from August 15, 2018 to September 7, 2018. Although the duration of the declaration was shorter in 2018, the impact of smoke on the aviation community was greater than the previous year because the horizontal visibility at the airports dropped lower for an extended period of time. Flights were either cancelled or rescheduled at several BC interior airports (2).
The aviation meteorologists at the Canadian Meteorological Aviation Centre in Edmonton received numerous early morning calls inquiring about the visibility trend at the smoky BC airports in August 2018. However, it was a difficult question to answer because it was unusual to have prolonged widespread low visibility due to smoke in the past and it was difficult to have a grasp on the intensity of smoke when hundreds of fires were burning simultaneously. Due to the health concerns from inhaling small particulate matter, PM2.5 concentrations are computed by the dispersion models to help forecasting air quality during wildfire smoke episodes. However, visibility is not yet an output from the available dispersion models, so PM2.5 model outputs were also used to help forecasting visibility. In order to make better use of PM2.5 model outputs, my August 2018 smoke case study investigated the relationship between PM2.5 and visibility to help forecasting visibility severity in wildfire smoke.
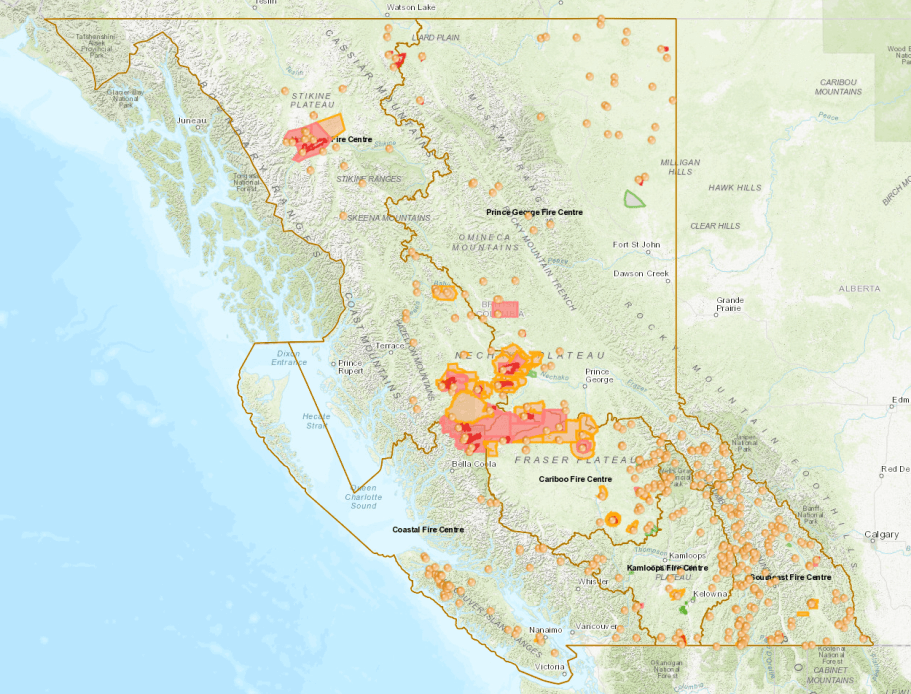
The typical upper ridge of high pressure pattern over British Columbia gives clear skies in summer and dries out fuels conducive to huge wildfires. Most of the wildfires result from lightning strikes igniting the initial fires and a few wildfires are human-caused. In late July and majority of August 2018, an upper ridge of high pressure was predominantly in place and it was the ideal setup to dry out the fuels to burn. The largest fires developed in central and northwestern British Columbia and hundreds of smaller fires were burning all over the province (Figure 1). Smoke from these fires not only choked British Columbia but also spread into the Prairies and gave low visibility and poor air quality (Figure 2).

My case study examines the relationship between visibility and PM2.5 using August 2018 data from 15 sites in British Columbia and Alberta, where the worst visibilities were observed. It is evident that as PM2.5 concentration rises, visibility drops (Figure 3). To fit a prediction curve without the complication of nonlinear regression, a linear regression was applied to ln(visibility) vs. ln(PM2.5) (Figure 4). By applying exponential to the ln equation, a power function was established to relate visibility and PM2.5 at each site. The math is shown below:
ln(vis) = b + a * ln(PM2.5)
vis = exp(b) * PM2.5^a
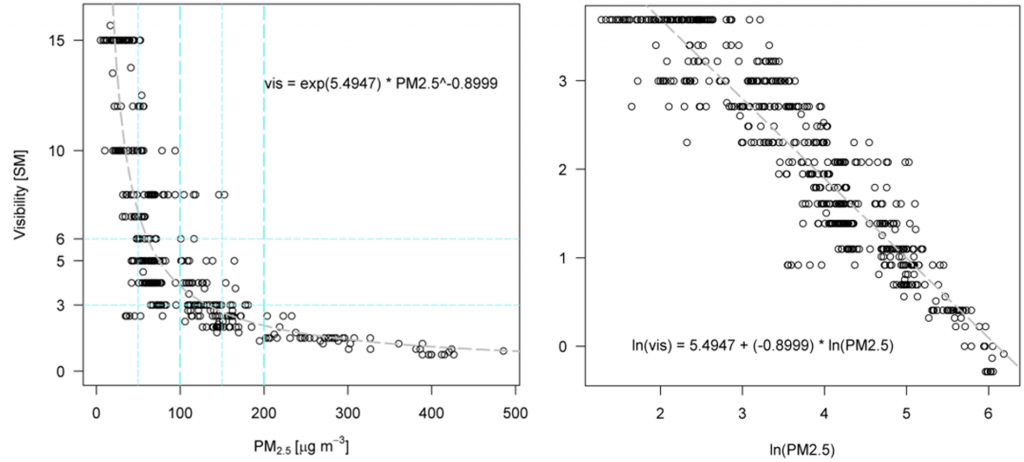
Figure 4 (Right). Scatterplot of ln(vis) vs. ln(PM2.5) and the fitted linear regression line.
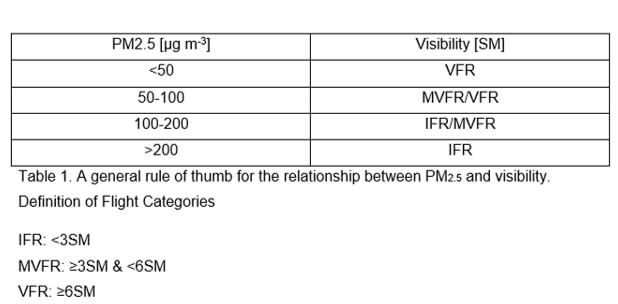
When it comes to operational forecasting, a general rule of thumb is always more useful than equations. The relationship between visibility and PM2.5 based on all the scatterplots is summarized in Table 1. Visibility forecast for airports is particularly important when the flight category changes. A general concern is when visibility drops to Instrument Flight Rules (IFR), defined as below 3 statute miles in horizontal visibility. All the sites gave IFR visibility when PM2.5 rose above 200 µg m-3. When PM2.5 was in the 100 – 200 µg m-3 range, IFR visibility was also a possibility. An interesting note here is that when PM2.5 is above 200 µg m-3, PM2.5 alone will give Air Quality Health Index (AQHI) of 7 or above, which is categorized as high health risk.
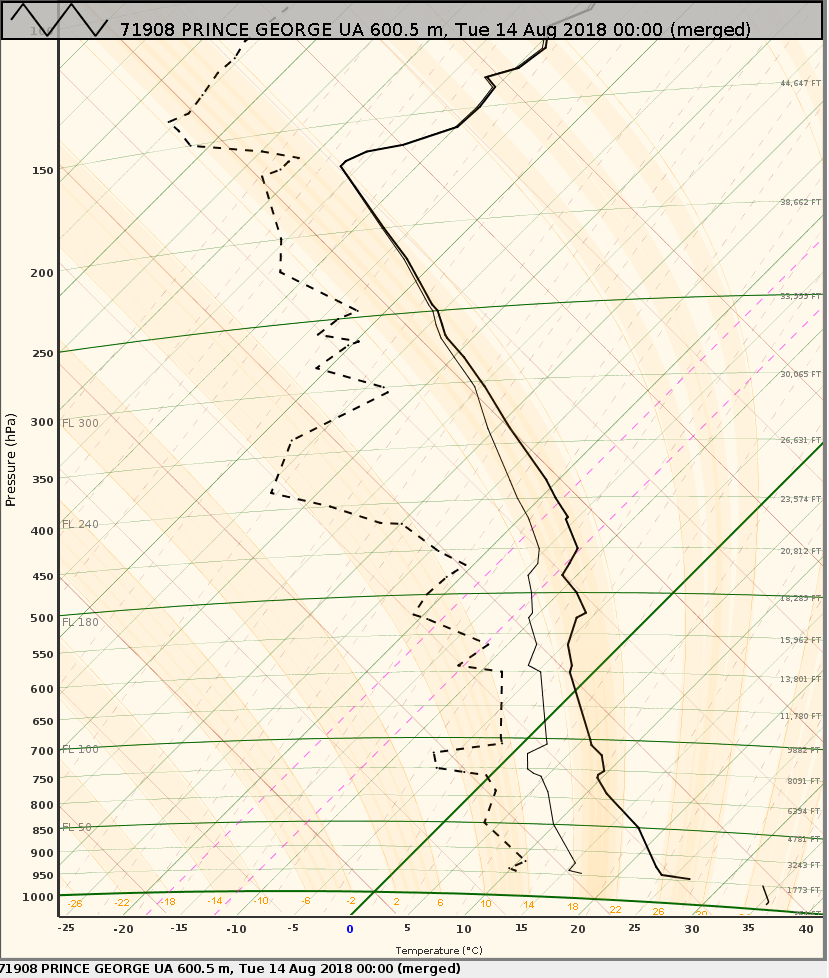
The scatterplot for Kamloops shows a few occasions when visibility dropped with low PM2.5. In this case, visibility reduction was likely due to mist/fog, or a combination of mist/fog, and smoke. When fog is the main reason for visibility reduction, visibility should improve with a diurnal trend in summer. However, when smoke is the main reason for visibility reduction, visibility may drop in the afternoon instead of improving. When there is a temperature inversion at mid-levels, the smoke plume would be trapped under the inversion layer. For example, the 00Z temperature sounding at Prince George on August 14, 2018 had a temperature inversion at around 700hPa (Figure 5). This inhibited the smoke plume to disperse to a higher altitude. The surface warmed up in solar radiation and it destabilized the surface layer. This surface instability dispersed smoke plume from aloft to the surface. As a result visibility got worse during the day.
How did the wildfires do in Western Canada in the summer of 2019 compared to the previous two years? In 2019, several “out-of-control” wildfires were burning in May over northern Alberta. The huge fires in northern Alberta established much earlier than the previous two years when the major fires were located in British Columbia. The fuel was likely prepared to burn as early as May due to the dry winter in the Prairies. When the widespread smoke travelled to Edmonton, PM2.5 peaked as high as 1880 µg m-3. For the rest of the summer, smoke was kept north of the major cities in Alberta as thunderstorm season started.
The typical upper ridge pattern over British Columbia was all short-lived in the summer of 2019 and instead we had several low pressure systems giving precipitation and preventing major wildfires to establish. However, a ridge of high pressure was often in place in Yukon. Wildfires in Alaska and Yukon kept Northwestern Canada fairly smoky due to a lack of precipitation. In summary, smoke was also an issue for Western Canada in 2019 but it only affected the less populated areas.
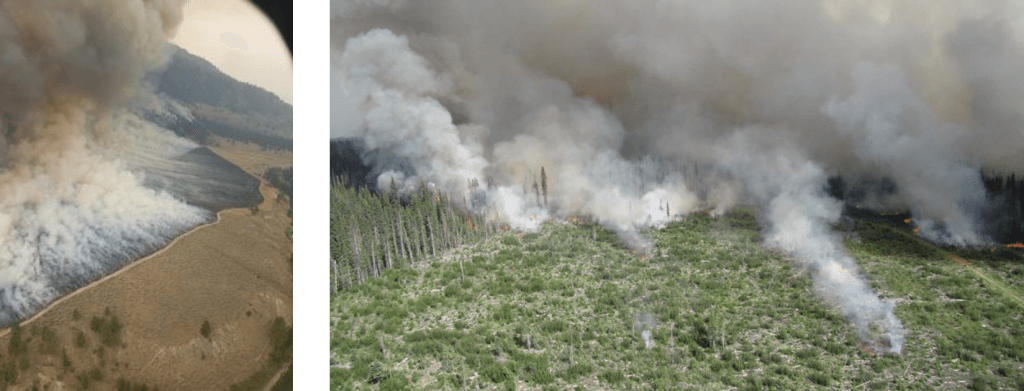
Figure 7 (Right). Shovel Lake, BC in August 2018 (Source: Photo from BC Wildfire Service).
When a stagnant ridge of high pressure over BC dominates in summer for a month or more, wildfire smoke will likely return again. The extent and severity of smoke at the surface depends on the atmospheric temperature profiles during the wildfire smoke episode. My smoke case study for August 2018 has established the relationship between PM2.5 and visibility to help operational meteorologists predict visibility given the PM2.5 model outputs. My case study can also be beneficial to air quality forecast for communities where air quality sensors are unavailable but visibility is monitored at the airports.
References
(1) https://news.gov.bc.ca/releases/2018PSSG0061-001584
(2) https://www.cbc.ca/news/canada/british-columbia/bc-wildfires-1.4791099
About the Author

Yimei Li is an operational meteorologist at the Canadian Meteorological Aviation Centre located in Edmonton, Alberta. She studied atmospheric science at the University of British Columbia. Her interest in air pollution meteorology is developed from air pollution research projects at UBC and co-op work terms at the Pacific Storm Prediction Centre. She was a trainee of the CREATE-AAP (Atmospheric Aerosol Program funded by NSERC) during her Master’s studies in air pollution meteorology. She will continue to contribute in weather forecasting and air pollution meteorology for years down the road.
More Like This:
Canadian Meteorological Aviation Centre, visibility forecast, Western Canada, wildfire smoke, Yimei Li