
Air Pollution in the Time of COVID-19
– By D.G. Steyn, Department of Earth, Ocean and Atmospheric Sciences, The University of British Columbia, Vancouver, B.C., and Kyle Howe, Air Quality and Climate Change, Metro Vancouver Regional District, Burnaby, B.C. –
The COVID-19 pandemic is disrupting many aspects of society globally, nationally and locally. The most direct effect is the human health tragedy of increased morbidity and mortality caused by the disease. Beyond that, the legislated curtailment of human movement to slow the spread of the virus has resulted in economies being placed in what has been called a “medically induced coma”. Closely associated with the sharp slowdown in economic activity has been the reduction in fossil fuel consumption from most source sectors. A particular consequence of this reduction has been an improvement in local air quality, and an associated reduction in greenhouse gas emissions in all jurisdictions. The improvement in air quality has been noted in many locations. The popular press abounds with photographs of previously seldom-seen mountain vistas, now visible. Some organizations have used satellite – or mobile monitoring data – to provide semi-quantitative analyses of the improvement in air quality by contrasting before-COVID-19 conditions with present conditions.
Our objective here is not to understand changes in ambient air quality conditions due to the pandemic, but to understand resultant emissions reductions. This preliminary study is intended to serve as a starting point for detailed emissions analyses, and the following ambient air quality modelling studies. These studies will be needed by regulatory agencies in fulfilling their air quality and greenhouse gas management strategies as the COVID-19 pandemic could offer a glimpse at the magnitude of emission reductions which may be needed to achieve the benchmarks set in these strategies.
We base our analysis on ambient air quality data from fixed point monitors in traffic-dominated locations. To provide an indicator of traffic emissions, we analyze NOx (the sum of NO and NO2) as this mixture is a good indicator of total traffic emission and accounts for chemical transformations between NO and NO2. The data will be drawn from monitoring locations very close to high traffic roadways so as to avoid the effects of chemical transformation of NO to NO2.
We choose two monitoring sites which are representative of traffic emissions from the Lower Fraser Valley Air Quality Monitoring Network and both happen to be in the City of Vancouver as representative of traffic emissions. The sites are: T001 – Robson Square (a location in the central business district of downtown Vancouver, dominated by light-duty vehicles) and T050 – Clark Drive at 11th Avenue (a near-road location at a busy intersection with a higher proportion of truck traffic than at T001). Both stations are known to represent locations dominated by traffic emissions. Our analysis uses data from 2020.03.21 (when all non-essential businesses in B.C. were closed) to 2020.04.15 to represent emissions during the pandemic and contrast those with measurements from the corresponding period in 2019. We note that an analysis of springtime data will avoid warmer conditions when chemical transformation is likely to be increasingly important. The core of our analysis will be quantile-quantile (Q-Q) plots of NOx for the springtime period at the two stations. Figures 1 (for T001) and 2 (for T050) present the 5th to 95th percentiles (in 5 percentile steps). We omit the upper 5 percentile in order to exclude conditions under which meteorology might dominate over emissions, but make no further effort to control for meteorological variability. We note that during the period of analysis, weather on the south coast of British Columbia was dominated by a ridge of high pressure with reduced cloudiness, almost no precipitation, low nighttime temperatures and modest daytime high temperatures. By contrast with typical Vancouver springtime conditions, this would result in a modest increase in mean ambient air pollution concentrations. We assume that the length of record (20 days, 500 hourly averages) will result in statistically meaningful results.
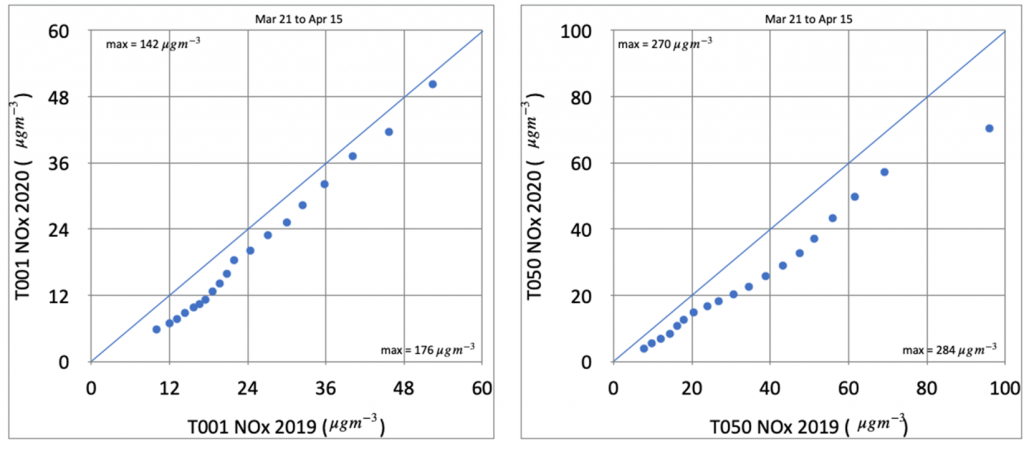
Figure 2 (Right). Q-Q plot of ambient NOx for 2020 vs 2019 at T050
The Q-Q plots in Figures 1 and 2 clearly show reduced NOx at both T001 and T050 for all percentiles in 2020, compared to 2019. This is a strong indication that traffic related emissions have been reduced due to the societal restrictions during the early phases of the COVID-19 pandemic. This finding is consistent with traffic counts from the City of Vancouver which show a mean reduction of approximately 50% in and out of the downtown core. At the Metro Vancouver T050 station, a reduction of total vehicle volume of nearly 40% was measured, compared to the same period in 2019.
While the objective of this simple statistical analysis is to illustrate differences in emissions, a number of broader conclusions can be drawn. The results point to the need for more thorough analyses of emissions during the pandemic, and as societal restrictions are relaxed. An analysis of improved ambient conditions during this “involuntary experiment” could be used to understand the level of emissions reductions needed to achieve more long-lasting improvement of ambient conditions, though clearly such emissions reductions cannot come about through restriction of economic activity as this would be societally unsustainable.
About the Authors
Douw Steyn, PhD, ACM, FCMOS is a Professor Emeritus of Atmospheric Science at The University of British Columbia, in the Department of Earth Ocean and Atmospheric Sciences. His professional, teaching and research activities are in the fields of air pollution meteorology, boundary layer meteorology, mesoscale meteorology, environmental science and interdisciplinary science. His research involves measurement and modelling studies of regional air pollution, especially in regions with complex terrain. He has worked extensively on the statistics of air pollution, air pollution monitoring and monitoring network design. He is a winner of the UBC Killam Teaching Prize, the Canadian Meteorological and Oceanographic Society Andrew Thompson Prize in Applied Meteorology, and the Canadian Federation for Earth Sciences Mentorship Medal. He has served as Chair of the scientific committee that leads the International Technical Meeting series on Air Pollution Modelling and its Application. He publishes regularly in international peer reviewed literature, and is Director of Publications for the Canadian Meteorological and Oceanographic Society. He is an Accredited Consulting Meteorologist, has international consultancy experience in his areas of expertise, and has provided expert testimony in numerous court cases and appeal board hearings in British Columbia.

Kyle Howe, MSc., is an Air Quality Planner at the Metro Vancouver Regional District in the Air Quality and Climate Change Division. He holds a master’s degree in Meteorology from the Pennsylvania State University and has worked professionally in the field of air quality in British Columbia since 2010. He has worked extensively in dispersion modelling and has participated in numerous environmental assessments. He has provided expert testimony related to dispersion modelling and air quality for both appeal board hearings and in legal cases. His work at the Metro Vancouver Regional District includes overseeing the data acquisition from the Lower Fraser Valley Ambient Air Quality Network as well as developing analytical techniques and tools to enhance our understanding of air quality trends and emerging air quality issues in the region.
More Like This:
COVID-19, Douw Steyn, emissions reductions, Kyle Howe, Lower Fraser Valley Air Quality Monitoring Network