
Did Anthropogenic Climate Change Increase the Chance of an Extreme Wildfire in the Fort McMurray Area?
– By Megan Kirchmeier-Young, Pacific Climate Impacts Consortium, University of Victoria –
A summary of a recent paper by Kirchmeier-Young et al. that describes an event attribution analysis to quantify the increase in seasonal metrics of extreme wildfire risk for a region in western Canada.
High impact extreme events, like the large wildfire near Fort McMurray AB in May 2016, often prompt questions regarding the role played by human-induced climate change. The answer to such questions can be found using event attribution. The methodology for event attribution and current status of research in this area are summarized in a report released by the American National Academies of Science, Engineering, and Medicine (NASEM) last year [1].
Event attribution typically sets out to identify the contribution of human influence to the probability of occurrence of a given extreme event by comparing sets of climate model simulations with natural climate influences only and with both anthropogenic (human) and natural influences. A common parallel comes from the field of epidemiology. Just as the presence of certain behavioral or environmental factors can increase the likelihood of a person developing a particular disease, the presence of anthropogenic emissions can increase the likelihood of a particular climate extreme.
A recent study by Megan Kirchmeier-Young, Francis Zwiers, Nathan Gillett, and Alex Cannon published in Climatic Change (DOI: 10.1007/s10584-017-2030-0) performs an event attribution analysis to investigate the contribution of human emissions to extreme fire seasons in a region in western Canada that includes Fort McMurray.
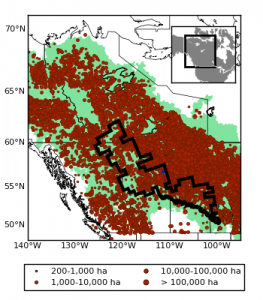
To set the stage, in Canada, around 2.1 million hectares are burned each year, on average with most large fires being ignited by lightning [2]. Figure 1 displays the locations of large fires in western Canada during 1980-2014, which occur predominately in the boreal zone. Numerous studies have projected increases in fires or fire risk in North America with increased greenhouse gases (e.g., [3,4,5,6]) and this is of concern for both fire management agencies and communities in high-risk areas.
This study utilized large ensembles of the CanESM2 model, developed and run at Environment and Climate Change Canada’s Canadian Centre for Climate Modelling and Analysis. The analyses of these ensembles is a core contribution of the Canadian Sea Ice and Snow Evolution (CanSISE) Network project. It includes ensembles of 50 realizations of the full earth-system model that utilized all forcings, which includes both the natural (solar and volcanic) and anthropogenic (greenhouse gases, aerosols, land-use, ozone, etc.) components. Each realization in the ensemble should represent the same “forced” signal due to the external influences listed above, but each realization will contain different random variations about that signal that reflect the natural chaotic variability of the climate (i.e., the so-called butterfly effect). Using a large ensemble, here 50 realizations, should capture most of this internal variability. In addition, a second ensemble contains 50 realizations of the model that utilize only natural factors. All of the model data were downscaled to a higher spatial resolution, to better represent influences of the topography in the region, and bias corrected towards a dataset based on observations.
To provide a broad assessment of fire risk, temperature, relative humidity, wind speed, and precipitation from the model data were used to calculate indices from the Canadian Forest Fire Danger Rating System (CFFDRS). CFFDRS indices are used widely across Canada by fire managers and researchers to describe the availability of burnable fuels and potential fire behaviour. For this study, the CFFDRS indices were summarized using the 90th percentile value of each index during the fire season; the 90th percentile is the value exceeded by only 10% of days and it provides a measure of the general severity of each index for the year. Metrics describing the number of days each season with high potential for fire spread, as well as indicators of the fire season start, end, and length were also used. All metrics were summarized for the homogeneous fire regime zone [7] that contains Fort McMurray (black outline in Figure 1).
For each metric described above, a threshold was chosen to designate an extreme level and the probability of exceeding this threshold in a fire season was calculated from the large ensembles for both all and natural-only forcing. Data from 2011-2020 were used to represent the current climate. A “risk ratio” is calculated to compare the probability of each event between the all and natural-only ensembles. The risk ratio is a simple ratio of the probability of an extreme fire season under all conditions to the probability of an extreme fire season under natural conditions; the resulting value describes how many times as likely an extreme fire season would be as a result of the anthropogenic component.
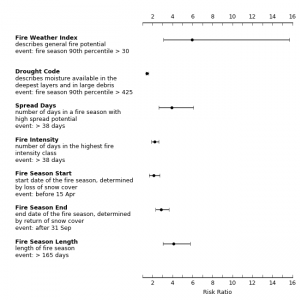
Figure 2 summarizes the risk ratio results for a few of the metrics based on Table 2 of the described paper. For each metric listed, the risk ratio value is shown with the point and the whiskers extending to each side indicate the uncertainty on this value. For example, a fire season lasting longer than 165 days is about 4 times as likely when anthropogenic influences are included, though this ranges from 3 times to almost 6 times as likely. A risk ratio exceeding 1 indicates that anthropogenic forcing increases the probability of the event in question and this is observed for all metrics. Finding an anthropogenic contribution to increased fire risk for many different types of metrics increases confidence in the event attribution. For the metrics shown here, and most other metrics shown evaluated in the paper, anthropogenic forcing experienced to date results in extreme fire risk events being 1.5 to 6 times as likely.
The results demonstrate that, based on the climate model utilized here, the Fort McMurray fire of 2016 occurred in a world where fire seasons often start earlier and last longer, where there is a general increased risk of extreme fire potential, and where there are a higher number of potential spread days that can result in the growth of a large fire. These increased fire risks are the result of anthropogenic influences.
Given the current wildfire situation in BC, one may wonder about the influence of human emissions on fire risk in other regions of western Canada. The landscape in BC is different from the region described in this study and will require different considerations in the calculation of the indices as well as in the choice of metrics and thresholds. The authors are currently working on extending the above work to answer this question.
References:
[1] NASEM 2016, DOI: 10.17226/21852
[2] Natural Resources Canada, http://cwfis.cfs.nrcan.gc.ca/home
[3] Flannigan et al. 2009, DOI: 10.1111/j.1365-2486.2008.01660.x
[4] Flannigan et al. 2013, DOI: 10.1016/j.foreco.2012.10.022
[5] Wang et al. 2015, DOI: 10.1007/s10584-015-1375-5
[6] Wotton et al. 2009, DOI: 10.1071/WF09002
[7] Boulanger et al. 2012, DOI: 10.1071/WF11073
[8] Brandt 2009, DOI: 10.1139/A09-004
About the Author: Megan Kirchmeier-Young
Megan is a Post-Doctoral Fellow at the Pacific Climate Impacts Consortium at the University of Victoria. As part of the Canadian Sea Ice and Snow Evolution (CanSISE) Network, she has been working on the attribution of extreme events.