
The Billion Dollar Calgary Hailstorm of 13 June 2020, Part I: Overview
– By Paul Joe, Ronald E. Stewart, and Sudesh Boodoo –
Abstract
A radar analysis of the Calgary hailstorm of 13 June 2020 is presented. Insured damages in the City of Calgary were estimated at over $1.2B which is the highest ever recorded for Canada. The core of the damage area covered a 10-15 km2 area in northeast Calgary and this damage was produced within a 10-15 minute period in the early evening. Volume scan Doppler polarization-diversity data were used to examine this event using Environment and Climate Change Canada’s S-Band polarization radar located at Strathmore, Alberta which is 40 km east of Calgary. The radar performs a seventeen elevation volume scan every six minutes.
The synoptic environment was conducive to severe thunderstorm development but required extra lift to overcome the capping inversion. Observations indicate that possible sources for the lift included low level convective boundaries, the mountain-plains circulation and thunderstorm interactions. The main storm initiated and explosively intensified in south Calgary. To the east, a westward moving, very narrow but less intense storm developed that interacted and merged with the urban storm. The combined storm produced very large to giant hail (golf ball, softball and larger sizes).
1 Introduction
On 13 June 2020, a major hailstorm struck northeast Calgary causing more than $1.2 billion of insured damages within a 15-20 minute period in the early evening. The core area with most of the damage covered less than 10-15 km2 just east of the Calgary Airport (Figure 1) where hail was reported to be larger than softball size (giant hail, see Table 1). A survey of the hail damage was conducted by insurance adjusters (personal communication, Glenn Smith, Catastrophe Response Unit Group) and is indicated by black and red contours in Figure 1).
The objective of this study is to document the development and morphology of the storm using the radar data. It is broken into three parts: Part I, Overview; Part II, Explosive Growth, Merging and the Meso-Front; Part III, Hail Size and Weather Modification Aspects.
In the following, all times are reported in Coordinated Universal Time (UTC). Note that 00 UTC 14 June 2020 is 18 Mountain Daylight Time 13 June 2020.
| Category | Size [cm] | Size [in] | Comparative |
| Small | 0.50 – 2.54 | 0.20 – 1.00 | pea to nickel |
| Large | 2.54 – 4.44 | 1.00 -1.75 | quarter to golf ball |
| Very Large | 4.44 – 6.99 | 1.75 – 2.75 | golf to baseball |
| Giant | > 6.99 | > 2.75 | baseball, grapefruit, softball |
Table 1: Hail Categories. This table provides a summary of commonly used descriptions for hail size (NWS, 2024).
2 Background
The summer of 2020 was abnormally intense with three hail-related catastrophic events (> $500M in insured damages) in the Calgary area which is located within the hail alley of Canada. In many years, there are none. Hailstorms in this area were studied from the sixties to the eighties contributing to their seminal understanding (Chisholm and English, 1973; Kochtubajda et al., 1996; Strong et al., 2007; Sills and Joe, 2019).
Based on the forecasts, June 13 2020 was expected to be a strong convective day. The 0000 UTC 14 June 2020 sounding from Stony Plain, Alberta (not shown) indicated that the atmosphere was potentially unstable with a CAPE (Convective Available Potential Energy) of 2216 J/kg. CAPE is a measure of the potential for strong updrafts and thunderstorm formation. The CIN (Convective Inhibition) was -40 J/kg and is a measure of the energy of the additional forcing (lift) required to overcome the capping inversion. The level of free convection was 3.4 km above sea level (ASL). The wind profile showed that the 700 hPa wind, an estimate of storm motion, was from 150° at 52 km/h and the low level 850 hPa winds were from 55° at 34 km/h.
In the past, forecasting the initiation and location of airmass thunderstorms (such as the situation here) was generally considered unpredictable. However, in the past thirty years, the initiation of convection has been found to often be associated with low level boundary layer features such as convergence lines (Purdom, 1976; Wilson and Schreiber, 1986; Wilson et al., 1998; Weckwerth et al., 1997, 1999; Hanesiak et al., 2004; Taylor et. al., 2011) as well as differential heating, hot spots, mesoscale fronts, mountain-plain circulations, and multi-scale interactions (Krauss and Martwitz, 1984; Strong et al., 2007; Sills et al., 2002; Sills et al., 2011; King et al., 2003). One detailed study in Brazil showed that low level boundary layer features were associated in the initiation or intensification of ∼75% of the thunderstorms (Lima et al., 2008). Hence, their identification by sensitive weather radars is key to understanding thunderstorm morphology as well as contributing to their early warning.
In November 2019, Environment and Climate Change Canada (ECCC) installed a S Band, Doppler, polarization diversity radar at Strathmore, Alberta (longitude -113.396011°, latitude 51.203322°, height 991 m ASL) replacing the C Band Doppler-only radar (ECCC, 2024). The new radar is less attenuated by heavy precipitation and hail. The data can be processed to deduce hydrometeor type. The radar operates on a 6 minute cycle, producing a volume scan consisting of 17 elevation angles from 0.4° to 24.7°. The range resolution is 500 m with a maximum Doppler range of 240 km. At 40 km from Calgary, the radar provides full coverage of the atmosphere from near ground to 20 km in height and is therefore ideally located to observe the storm. The radar was checked in the fall of 2019 and 2020 and found to be well calibrated during the summer of 2020.
3 Event Chronology
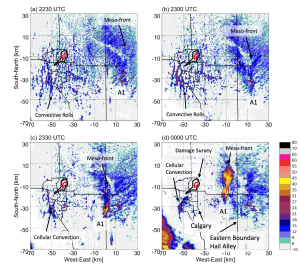
To the east of Calgary, there was a broad, diffuse north-south feature (on the 100 km scale) moving westward (Figure 1). This was associated with the mountain-plains circulation that results from the diurnal cycle of air flow on the east side of the Rocky Mountains. Overnight radiative cooling creates an eastward moving drainage flow from the mountains to the plains into the early morning hours. With solar heating on the east facing mountain slopes, the air rises and the circulation reverses during the day. A boundary is formed and is termed the meso-front here (Whiteman, 2000; Smith and Yau, 1993; Strong, 1989, 2007). Evapotranspiration during the day adds moisture to the westward moving air enhancing the potential for convection (Raddatz and Cummine, 2003). A small weak storm developed on the meso-front (Figure 1a, 2230 UTC 13 June 2020) that developed into a narrow (~30 km x ~5 km), intense (>55 dBZ) and steady thunderstorm (marked as Storm A1).
Figure 2a shows that at 0018 UTC 14 June 2020, the cells (marked by the letter B) were freely convecting which indicates that they overcame the CIN. They were slowly moving from the southwest. Rural-urban temperature (urban heat island) differences were small during the day but increased as evening approached. Therefore, the urban heat island thermal effect was considered to be a minimal influence in the development of the storm. However, Misumi et al. (2019) demonstrated that subtle dynamical urban texture effects (influence of buildings and street canyons) on the low level wind (for example, a 10° wind shift) can be a determining factor in the development of severe thunderstorms.
Figure 2b,c,d shows that, from 0030 to 0042 UTC, the cluster of convective cells had developed and consolidated into a large and intense thunderstorm (Storm B). Storm A1 continued to persist and expanded in size with heavy rain and possibly small hail. However, it would bypass Calgary to the north.
Figure 2a at 0018 UTC 14 June 2020, shows that clusters of northwest-ward moving storms (Storms A2 and A3) began to form on the meso-front to the south of Storm A1. Figure 2b, 0030 UTC 14 June 2020, shows that Storm A2 rapidly developed and that two rainbands (marked by dashed white lines in Figure 2b,c) formed in the convergence zone between Storms A2 and B. Convergence is inferred from the approaching motions of Storm B and Storm A1. The rainbands rapidly developed in the next six minutes (Figure 2c, 0042 UTC 14 June 2020). Storm A3 began to merge with Storm A2 (Figure 2c, 0036 UTC 14 June 2020). At 0042 UTC 14 June 220 (Figure 2d), Storms A2, A3 and the rainbands ahead of A2 consolidated into a multicellular storm complex and is labeled as Storm A2, hereafter.
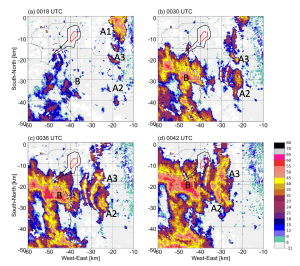
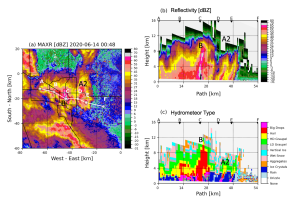
Figure 3a, at 0048 UTC 14 June, shows a MAXR (maximum reflectivity in a column) image. Figure 3b shows the vertical reflectivity structure of the storms. At the surface (Figure 3b), reflectivities in Storm A2 were greater than 55 dBZ suggesting heavy rain and perhaps only small hail at this time. However, Storm B shows a narrow band of reflectivity exceeding 65 dBZ extending vertically, indicating very large hail at the surface in a very small area. Storm B had reflectivities aloft greater than 70 dBZ indicating the potential for giant hail on the ground at a later time (typically 10-30 minutes).
Figure 3c shows hydrometeor type based on the polarization diversity data (Thompson et al., 2014). Only hydrometeor type (i.e., hail and not hail size) is available with current operational polarization-diversity analysis techniques. This supports the inference that Storm B, but not Storm A2, was producing hail on the ground.
Figure 3, 0048 UTC 14 June 2020, also shows the structure of Storms A2 and B just before they merged. In comparison with Storm A2, Storm B was taller (height of the top of 50 dBZ echo was 3 km versus 10 km, respectively), had a different vertical structure (maximum of reflectivity was at low levels versus aloft) and more intense (maximum reflectivity of greater than 70 dBZ versus 55 dBZ). These differences indicate different development environments and convection modes and different hydrometeor processes (i.e. hail embryo development from ice crystal or cloud droplet nucleation).
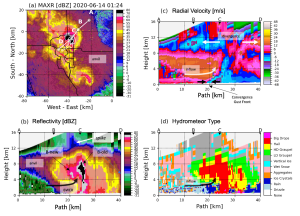
Figure 4, at 0124 UTC 14 June 2020, shows images of MAXR, cross-sections of reflectivity, Doppler velocity and hydrometeor type. The storm was at its peak intensity at this time. Figure 4b-d shows several classical severe storm features and include:
- (i) a bounded weak echo region (BWER, identified as an inverted open U-shape of reflectivity),
- (ii) a multi-cell structure showing new zones of hail growth (marked as B-old, B-new; identified by separated cores of strong reflectivity (e.g., 65 dBZ) and protuberances in the echo top heights (e.g., 40 dBZ)),
- (iii) strong gust front (marked by the black arrows in Figure 5c; the arrows overlay the location of positive and negative Doppler velocities away from and towards the radar, respectively; the arrows point to each other indicating a gust front which is a zone of strong convergence; this is also associated with the cold pool),
- (iv) low level inflow rising over the gust front (marked on the radial velocity cross-section by white curved arrow on Figure 4c and overlaid on reflectivity and hydrometeor type cross-section on Figure 4b and d),
- (v) high level divergence (analysed on the radial velocity cross-section and marked by straight white arrows as negative (or towards radar) and positive (or away from radar) velocities in Figure 4c) and associated anvil (expanded low reflectivity echo, Figure 4a,b; compare to Figure 3) and (vi) a reflectivity artifact marked spike (identified as a tapered anomalous reflectivity feature at the top of the storm due to radar antenna sidelobe reflections from the intense core).
Bounded weak echo regions indicate very strong updrafts and were first recognized in seminal hail studies in Alberta (Chisholm and Renick, 1972; Chisholm and English, 1973). The pulsed multi-cell structure indicates a long lived storm with repeated but short-lived large hail episodes on the ground. The strong convergence at low levels, the gust front, the cold pool and divergence at high levels are signatures of a mature long-lived and intense thunderstorm (COMET, 2024). The Doppler data show velocities relative to the radar (Figure 4c).The inflow into the mid-levels of the storm indicates a severe storm feature known as the mid-altitude radial convergence (MARC) Doppler signature. The narrow vertical feature (marked spike on Figure 5b) is a radar artifact in which the antenna sidelobe and the core of the storm is sufficiently intense to generate a detectable echo.
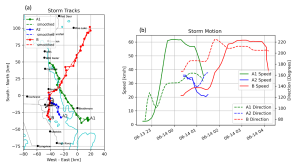
Figure 5a shows the distinctive storm tracks of A1, A2 and B. Storm A1 bypassed Calgary to the north. Storm A2 approached and merged with Storm B in northeast Calgary. After merging, the combined storms are designated as Storm B. As discussed earlier, these motions indicated that there was a broad area of convergence over the City of Calgary and development and intensification of the thunderstorms could be anticipated. Figure 5b shows that Storm A2 and B moved at 35 km/h from 150° and at 25 km/h from 190°, respectively; at a relative angle of 40°. Storm A2 slowed slightly to 20 km/h just prior to merging. The two storms fully merged at 0130 UTC 14 June 2020 and rapidly increased in speed to 60 km/h.
4 Discussion and Summary
The Calgary 13 June 2020 Billion Dollar hailstorm was the most expensive in Canadian history with greater than softball sized hail reported over a 10-15 km2 area in northeast Calgary within a 10 to 15 minute period.
Two separate and intense storms formed and converged over northeast Calgary. One storm (A2) formed along the mountain-plains circulation boundary (meso-front) and moved northwestward, and the second storm (B) formed in southeast of Calgary and moved northeastward. Both storms formed from the merger of complexes of multicellular storms.
The storms formed in different environments. Storms (A1, A2 and A3) along the meso-front were shorter, less intense and were surface based. They moved with the meso-front. Development of Storm (B) was consistent with the synoptic environment that was favourable to intense convection. In the pre-storm phase, the convection mode evolved from linear boundary layer convective rolls, to freely convective cells aloft, to multicellular thunderstorms that consolidate into a single thunderstorm (Storm B). The storm moved to the northeast with the 700 hPa steering flow. The two storms (A2 and B) merged and continued along the same track as Storm B. It was long-lived and persisted for several more hours.
The evolution and morphology of the merged storm was complex and several factors, including complex terrain, urban heat island and texture, thunderstorm interactions, surface processes, local effects and others, contributed to its extreme intensity but are not fully understood. The synoptic environment was potentially unstable and conducive to severe thunderstorms but required additional forcing to generate lift. There were at least two sources of convergence. One was due to the motion of the storms in relation to each other and the second was due to the thunderstorm outflows (gust fronts) caused by precipitation loading, evaporative cooling and perhaps other factors. This was a perfect storm scenario.
5 Acknowledgement
The radar data for this study was provided by Environment and Climate Change Canada.
References
Chisholm, A.J. and M.A. English, 1973: Alberta Hailstorms, AMS Meteor. Mono., 14(36), 98pp.
Chisholm, A. J. and J.H. Renick, 1972: The kinematics of multi-cell and supercell, Alberta hailstorms. Research Council of Alberta Hail Studies Rep. 72-2, 24-31.
COMET, 2024: Radar signatures of severe convective weather, https://www.meted.ucar.edu/education_training/lessons/193, (accessed 11 June 2024).
ECCC, 2024: Radar Network Overview, https://www.canada.ca/en/environment-climate-change/services/weather-general-tools-resources/radar-overview.html, (accessed 7 June 2024).
Hanesiak, J. M., R. L. Raddatz, and S. Lobban, 2004: Local initiation of deep convection on the Canadian Prairie Provinces. Bound.-Layer Meteor., 110, 455–470.
King, P. , M. J. Leduc, D. M. L. Sills, N. R. Donaldson, D. R.Hudak, P. Joe, and B. P. Murphy, 2003: Lake breezes in southern Ontario and their relation to tornado climatology. Wea. Forecasting, 18, 795–807.
Kochtubajda, B., C. Humphrey, M. Johnson and E.P. Lozowksi,1996: Alberta Hail Project Data Archive Available On The World Wide Web. BAMS 3, 564-567.
Krauss, T. and J. Marwitz, 1984: Precipitation processes within an Alberta supercell hailstorm. Journal of the Atmospheric Sciences. 41, 1025–1035. doi: 10.1175/1520-0469(1984)041<1025:PPWAAS>2.0.CO;2
Lima, M. A., and J. W. Wilson, 2008: Convective storm initiation in a moist tropical environment. Mon. Wea. Rev., 136, 1847-1864.
Misumi, R., Y. Shoji, K. Saito, H. Seko, N. Seino, S. Suzuki, Y. Shusse, K. Hirano, S. Belair, V. Chandrasekar, D.I. Lee, A. Pereira Filho, T. Nakatani and M. Maki, 2019: Results of the Tokyo Metropolitan Area Convection Study for Extreme Weather Resilient Cities (TOMACS). Bull. Amer. Meteor. Soc., 100, 2027-2041, https://doi.org/10.1175/BAMS-D-18-0316.1.
NWS, 2024: Hail Threat Defined, https://www.weather.gov/mlb/hail_threat#:~:text=Note%3A%20To%20be%20considered%20severe,golf%20balls)%20causing%20minor%20damage (accessed May 6 2024)
Purdom, J.F.W., 1976: Some uses of high-resolution GOES imagery in the mesoscale forecasting of convection and its behaviour. Mon. Weather Rev., 104, 1474-1483.
Raddatz, R.L., and J. D. Cummine, 2003: Inter-annual variability of moisture flux from the prairie agro-ecosystem: Impact of crop phenology on the seasonal pattern of tornado days. Bound.-Layer Meteor., 106, 283–295.
Sills, D. M. L., J. R. Brook, , I. Levy, P.A. Makar, J. Zhang, and P. A. Taylor, 2011: Lake breezes in the southern Great Lakes region and their influence during BAQS-Met 2007. Atmos. Chem. Phys., 11, 7955-7973.
Sills, D.M.L., P. Taylor, P. King, W. Hocking and I. Nichols, 2002: ELBOW 2001 – Studying the relationship between lake breezes and severe weather: Project overview and preliminary results. 21 Conf on Severe Local Storms, San Antonio, TX, AMS, 611-614.
Sills, D.M.L. and P. Joe, 2019: From Pioneers to Practitioners: A short history of severe thunderstorm research and forecasting in Canada. Atmos.-Ocean, 57(4), 249-261.
Smith, S.B. and M.K. Yau, 1993: The causes of severe convective outbreaks in Alberta. Part II: Conceptual model and statistical analysis. Mon. Wea. Rev., 121, 1126–1133.
Strong, G. S., B. Kochtubadja, P.W. Summers, J.H. Renick, T.W. Krauss, R.G. Humphries and E.P. Lozowski, 2007: 50th anniversary of hail studies in Alberta accomplishments and legacy, CMOS Bulletin, Special Issue, 35, 3-19.
Taylor, N. M., D. M. L. Sills, J. M. Hanesiak, J. A. Milbrandt, C. D. Smith, G. S. Strong, S. H. Skone, P. J. McCarthy, and J. C. Brimelow, 2011: The Understanding Severe Thunderstorms and Alberta Boundary Layers Experiment (UNSTABLE) 2008. Bull. Amer. Meteorol. Soc., 92, 739-763.
Thompson, E. J., S. A. Rutledge, B. Dolan, V. Chandrasekar, and B.L. Cheong, 2014: A dual-polarization radar hydrometeor classification algorithm for winter precipitation. JAOT, 31(7), 1457-1481.
Weckwerth, T. M., T.W. Horst, and J.EW. Wilson, 1999: An observational study of the evolution of hori-zontal convective rolls. Mon. Weather Rev., 127, 2160-2179
Weckwerth, T. M., J. W. Wilson, R. M. Wakimoto, and N. A. Crook, 1997: Horizontal convective rolls: Determining the environmental conditions supporting their existence and characteristics. Mon. Wea. Rev., 125, 505-526.
Whiteman, C. D., 2000: Mountain Meteorology: Fundamentals and Applications. Oxford University Press, 376pp.
Wilson, J. W., and W. E. Schreiber, 1986: Initiation of convective storms at radar-observed boundary-layer convergence lines. Mon. Wea. Rev., 114 , 2516-2536.
Wilson, J. W., N. A. Crook, C. K. Mueller, J. Sun, and M. Dixon, 1998: Nowcasting thunderstorms: A status report. Bull. Amer. Meteor. Soc., 79, 2079-2099.
Calgary, hailstorm, Paul Joe, radar analysis, Ronald E. Stewart, storm, Sudesh Boodoo, thunderstorm