
The Billion Dollar Calgary Hailstorm of 13 June 2020, Part III: Hail Size and Weather Modification Aspects
– By Paul Joe –
Abstract
On 13 June 2020, a hailstorm caused $1.2B of damage in a 10-15 km2 area in northeast Calgary within a 20 minute period. A radar-based overview of the storm’s initiation, explosive development and merging with a second storm was provided in Part I. Part II described details of the merger and the interaction with a meso-front. Here, in Part III, radar-based hail size swath analysis, a description of cloud seeding operations and a synthesis of the observations and unresolved questions are provided.
1 Introduction
On 13 June 2020, a hailstorm caused over $1.2B of insured damages in the City of Calgary. An overview was presented in Part I (Joe et al., 2024a). The storm was extreme and resulted from the merger of an air mass thunderstorm with a second storm which formed on a meso-front associated with a mountain-plains circulation. In Part II, detailed features of the storm evolution and meso-front interactions were presented to better understand the physical factors impacting the storm development (Joe et al., 2024b). The merging and meso-front interactions were complex and several explanations were advanced but further research is needed.
The objectives of this last part are to document the surface damage patterns based on radar estimated hail sizes, the weather modification seeding operations, and summarise outstanding research questions.
2 Hail Size and Swath
In general terms, the greater the water content, the greater the intensity of the precipitation and the larger the hail; the taller the storm; the stronger the updraft that is able to support the growth of large hail, and the higher the freezing level, the greater the time available to melt resulting in smaller hail. These factors are used to estimate hail size using radar.
The vertically integrated liquid water content (VIL) of the storm was used as a proxy for precipitation intensity. Assuming that reflectivity is totally due to rain (liquid), the Marshall-Palmer drop size distribution relationship (Marshall and Palmer, 1948) is used to estimate liquid water content (LWC). VIL is computed by integrating the LWC in a column from the reflectivity volume scan. The height of the 50 dBZ echo top is used as a measure of the height of the storm. The freezing level height was based on the 00 UTC 14 June 2020 sounding from Stony Plain, AB and is assumed to be constant for the analysis period.
These variables were used in an empirical relationship to estimate hail size (Witt et al., 1998; Joe et al., 2004; Ebert et al., 2004). While hydrometeor type including hail (regardless of size) is routinely estimated (Park et al., 2009; Lim et al., 2005; Thompson et al., 2014), techniques to estimate hail size using the polarimetry data are still in the research phase (Ortega et al., 2016).
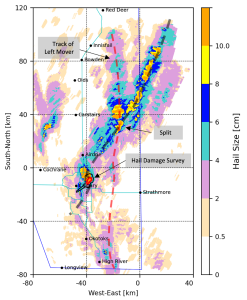
Figure 1 is a composite of individual radar hail size images that are made every six minutes from 2200 UTC 13 June 2020 to 0600 UTC 14 June 2020. The maximum value is used for overlapping data. During the early stages (0118 to 0136 UTC, 14 June 2020) of the event, Storm B (already merged with A2) moved slowly at ∼ 30 km/h. Later the storm speed almost doubled to ∼ 60 km/h (see Part I). As fast moving storms can result in the appearance of gaps in the hail swath, a semi-Lagrangian linear interpolation using the centroid velocity (see Part I) was used to aggregate individual images. The hail size estimates should be interpreted on a storm basis and not at the pixel or radar data resolution due to the manner in which the algorithm was developed (Witt et al., 1998; Joe et al., 2004) and so the swath area may be overestimated as the hail may follow trajectories determined by the storm airflow. The observations used to develop the empirical relationship were limited and so radar hail sizes greater than 10 cm are extrapolated, considered uncertain and hence they are limited in Figure 1.
Figure 1 shows that greater than 6 cm (very large hail, NWS 2024) fell in northeast Calgary coinciding with the damage survey. The maximum hail sizes subsequently decreased but, later on, very large hail was observed again. The swath of the very large hail (dashed black line in Figure 1) was episodic, indicating that the thunderstorm was multicellular and not a steady-state single-updraft supercell. The spatial extent of the swath was approximately 15 km by 150 km.
At ~0230 UTC 14 June, the storm complex split in an unusual fashion. The original storm moved to the left, slowly weakened and eventually died whereas a new intense storm developed on the right flank and moved in the same direction as the original storm. Typically, when an intense storm splits, two mature storms emerge with the storm on the right flank intensifying (as in this case) and deviating to the right while the storm on the left flank rapidly weakens (e.g., Joe and Dudley, 2000). Given the pattern of the left swath (red dashed line in Figure 1), it is enticing to make a link with earlier storms that formed on the meso-front. That is, the meso-front continued to sustain a storm with it.
3 Weather Modification
Operational weather modification activities have been conducted by the Alberta Severe Weather Management Society, a consortium of insurance companies, since 1997 to mitigate and protect urban infrastructure from large hail (Gilbert et al., 2016). With current construction standards in Alberta, small hail does not generally damage urban infrastructure except when accompanied by strong winds. The weather modification procedure is carried out by cloud seeding using silver iodide in the feeder or daughter clouds (the precipitation initiation zone of thunderstorms). Gilbert et al. (2016) pointed out that seeding is hypothesized to increase the number of hail embryos that will compete and use up the cloud liquid water, creating many smaller hailstones and thereby reducing the development and number of large hailstones. This is known as beneficial competition. The seeding may also stimulate the production of precipitation so water is removed early on and is not available for the production of hail and there are other hypotheses using the same seeding procedure but are not considered applicable in this case (Flossmann et al., 2019; personal communication, Terry Krauss).
Whenever a storm is detected on radar and anticipated to strike Calgary or any city in hail alley, seeding aircraft are deployed to seed the clouds (see Gilbert et al., 2016 for a description of the seeding procedures). The seeding materials are injected either at the base of the feeder clouds using wing-mounted flares or generators, or into the top of the clouds using flares that drop into the precipitation initiation zone. Seeding ceases when the storm is no longer a threat to municipalities or major industrial complexes or when the storm exits hail alley.
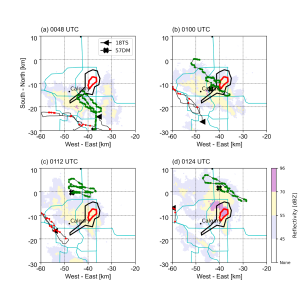
Figure 2 shows a sequence of images (12 minutes apart) to illustrate how the seeding was conducted in this event. The underlying image is a MAXR radar image with extreme reflectivities (>70 dBZ) are highlighted. The new growth areas and updrafts are outside these precipitation cores and the aircraft seeded these in these areas. In the example, below-cloud seeding was carried out on the forward (northern) flank of the storm and cloud top seeding was carried out in the rear (southern flank) of the storm. Note the Strathmore radar data is time stamped by the end of the scan cycle and has a temporal resolution of 6 minutes while the aircraft data have a time resolution of 2 seconds.
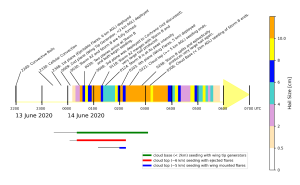
Figure 3 shows an underlying composite MAXR image (2200 UTC 13 June 2020 to 0600 UTC 14 June 2020) with overlaid aircraft tracks, seeding locations and seeding method for the entire data period. Table 1 provides a chronological synthesis of the morphology of Storm B and the seeding.
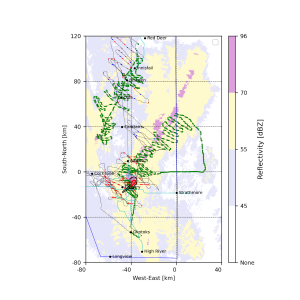
In anticipation of severe thunderstorms, one aircraft was deployed from Cochrane at 2348 UTC 13 June 2020 and was directed to Storm A1 and arrived at 0012 UTC 14 June 2020, however no seeding was done. A second aircraft was deployed at 0009 UTC 14 June 2020 and briefly seeded a storm near Okotoks at ~0029 UTC 14 June 2020. It did not develop and quickly died. The two aircraft were redirected to Storm B (see Part I and II) and began seeding at 0039 UTC. One aircraft seeded in the feeder clouds (<2 km AGL) levels) using wingtip generators in front of the storm at low levels and the other dropped flares in the rear of the storm from cloud top (~6 km). Another aircraft began seeding this storm at 0203 UTC 14 June and dropped flares from cloud top (~5 km) ahead of the storm. All cloud top seeding ceased at 0221 UTC. Low level seeding of Storm B ceased at 0306 UTC when the storm left hail alley. A fourth aircraft seeded a storm to the northwest of Storm B, near Cochrane, but is not discussed here.
Given its explosive behaviour, the seeding operation was as timely as could be expected as Storm B was only identifiable on the Strathmore radar at 0030 UTC 14 June 2020, 9 min earlier. The cloud seeding operator (Weather Modification Incorporated) have their own radar operating on a 4 minute cycle and may have identified the storm several minutes earlier (not analysed here). The storm was producing large hail over southern Calgary starting at about 0036-0042 UTC based on radar and the damage survey. It was over northeast Calgary from 0118 UTC to 0142 UTC and at its peak intensity (reflectivity) at 0124 to 0130 UTC. In total, seeding operations on Storm B lasted for two and half hours. Note that no seeding was carried out on any storms directly associated with the meso-front.
| Date-Time | Event | Comment and Open Questions |
| 2200 UTC 13 June 2020
Pre-storm convective rolls |
Convective rolls are observed southwest of Calgary. | Boundary layer convection is capped by an inversion. The most intense severe storm originated in this region. How reliable is this as a precursor for severe convection? Would seeding these rolls at this stage disrupt or prevent the initiation of cellular convection? |
| 2330 UTC 13 June 2020 – 0000 UTC 14 June 2020
Cellular Convection |
Convective rolls (linear) change to cellular convection
Storm A1 forms at 2330 UTC and is mature 30 minutes later |
Convection is observed aloft (5-7 km).
Would seeding the cellular convection at this time disrupt the initiation and development of future severe storms? Very short lived (30 minutes at most). |
| 2348 UTC 13 June 2020 to 0036 UTC 14 June 2020
Seeding Aircraft Deployed |
First seeding aircraft deployed from Cochrane, in anticipation of storms. (a) Directed to Storm A1 at ~2355 UTC, arrives at 0012 UTC but no seeding is done. (b) Aircraft is redirected to a storm near Airdrie at ~0024 UTC but no seeding is done. (c) Aircraft is then redirected to Storm B at ~0024 UTC. | Second aircraft is deployed from Cochrane at ~0009 UTC: (a) Directed to storm south of Okotoks; (b) Seeding commences at ~0029 UTC and ends ~0031 UTC; (c) Directed to Storm B and seeds a small storm just north of Okotoks, while in transit. |
| 0030 UTC
Storms fully formed |
Storm A2 and Storm B are fully formed.
Storm A1 bypasses Calgary. Storm A3 form and merge with Storm A2. |
Storm is identified when reflectivities exceed 35 dBZ.
Would seeding the weaker A2 and A3 storms be more effective than seeding the more intense A1 storm to reduce the impact of convergence and the merging? |
| 0039 UTC
Seeding of Storm B begins; Storm B already producing large hail |
Both aircraft arrive at Storm B and both begin seeding at ~0039 UTC. Seeding is continuous.
Based on radar hail size estimate, damage survey and location, Storm B was already producing large hail (golf ball). |
This is approximately 9 minutes after storm identification. One aircraft is seeding continuously ahead of the storm (<2 km AGL). The second aircraft is dropping flares in the rear of the storm (~6 km AGL). |
| 0048 UTC
Seeding of Cochrane Storm begins |
Third aircraft was deployed and directed to storm north of Cochrane. Storm was seeded starting at ~0112 UTC and ended at ~0333 UTC. | For information only. |
| 0118 UTC
Storms A2 and B merge, very large hail |
Storm A2 begins to merge with Storm B. Storm B is producing very large hail. | Hail size estimate from radar coincides with location of large and very large hail on the damage survey.
How does merging affect the hail growth processes? How does the interaction with the meso-front affect the intensity of the storm? |
| 0124 – 0130 UTC
Storm A2 at peak |
Storm B is at its peak intensity (>70 dBZ reflectivities) and size and produces giant hail. | Radar hail size estimate coincides with location of giant hail found by surface damage survey. |
| 0203 UTC
Storm B seeding by 3rd aircraft |
A fourth aircraft was deployed at 0118 UTC, directed to, arrived at and seeds Storm B from 0203 UTC to 0221 UTC. | Seeding was conducted using wing mounted flares at ~5 km AGL. Storm was well north of Calgary. |
| 0221 UTC
Cloud top seeding ends. |
Seeding by aircraft ahead of Storm B continues, but cloud top seeding ends. | Storm is north of Airdrie and no longer a threat to urban infrastructure. |
| 0248 UTC
Storm B splits |
Storm B splits.
Storm B resumes producing very large hail (and bigger) patterns in an episodic manner. |
Original storm moves left, new storm forms on right rear flank, quickly intensifies and shifts slightly and propagates in the same direction as original Storm B.
The meso-front appears to have an overarching role, what is it? Are there nocturnal thunderstorm processes influencing the re-intensification and multicellular structure of Storm B? |
| 0306 UTC
Seeding Ends |
Seeding of Storm B ceases. Seeding of the Cochrane storm ends at 0333 UTC. | Storm exits Hail Alley but radar analysis continues till 0600 UTC. |
Table 1: Event synthesis, comments and open questions.
4 Synthesis and Discussion
The storm was complex and formed from multiple convective cells, developed rapidly and produced large hail within twelve minutes (Table 1 and Figure 4.). The storm merged with a second storm and produced very large and giant hail within an hour. The storm was long-lived and intense for at least 4.5 hours from 0030 UTC 14 June 2020 to 0600 UTC 14 June 2020 (end of analysis) with a multicellular pattern of very large/giant hail on the ground. There are insufficient reports (official observations, from social media or elsewhere) to verify the radar swath analysis. Very dense surface observation networks of sensors capable of observing large hydrometeors and large sampling volumes are needed for quantitative analysis and hail reports through social media are needed and encouraged to provide geographical coverage (Elmore et al., 2014; Ortega et al., 2016).
The seeding information was presented without judgement or attribution to its impact. Within the scientific community, the expert opinion is that the effect and impact of seeding of thunderstorms is inconclusive and results are difficult to prove (WMO, 2016).
In a recent statistical study over Alberta, VIL was used as a surrogate for hailstorm intensity or hail size (Pirani et al., 2023). Changes in VIL between seeded versus unseeded storms were compared for long track storms (>1 hour) using ten years of radar data. A weak but statistically significant relationship was found in which strong storms decreased in intensity and weak storms increased in intensity with seeding. The effect was strongest after a 30 minute lag after seeding. The authors note that caution in attribution to seeding should be exercised as there are many confounding factors.
Table 1 synthesises the storm and seeding history and identifies some open questions. It was a complex storm that evolved from linear to cellular convection, then from multicellular to single-cellular storm and back again. One of the ongoing scientific challenges is understanding the nature of long-lived Alberta storms and whether they are continuous with a single continuous updraft (supercells) or multicellular/pulse in nature (Strong et al., 2007). In this case the storm cyclically re-organized over several hours.
Early identification of severe storm initiation to improve weather warnings is a nowcasting challenge (Wilson et al., 1998). Many factors were identified, including the synoptic environment, meso-scale features (diurnal and mountain-plain circulation effects), complex terrain and urban texture (inferred but not directly discussed), and the interaction of merging thunderstorms, amongst others (Strong et al., 2007; Taylor et al., 2011).
There are also many unresolved scientific issues related to cloud microphysics and precipitation processes related to hail formation (Morrison et al., 2020). These were not addressed here and a deeper investigation using microphysical numerical models and polarization diversity radar is warranted (Lu et al., 2023).
There are also unresolved weather modification questions (Gilbert et al., 2016; Flossmann et al., 2019; Pirani et al., 2023). Given that merged storms lead to enhancement (size and intensity), should a different seeding strategy be adopted. An open question is whether early seeding the weaker storms on the meso-front, the convective rolls or the cellular convection to disrupt their intensification would be an effective strategy.
5 Summary
The Billion Dollar Hailstorm of 13 June 2020 was presented in three parts. The overall objective of the study was to share with the readers some of the many aspects of this extreme and unique hailstorm that affected the lives of many Calgarians and caused more than $1.2B in damages. It was an awe-inspiring storm and this analysis posed more questions than answers – a researcher’s delight.
6 Acknowledgement
The radar data for this study were provided by Environment and Climate Change Canada. The seeding data were provided by Adam Brainard of Weather Modification, Incorporated on behalf of the Alberta Severe Weather Management Society. Adam’s support is greatly appreciated. The initial investigation was contracted by the Institute of Catastrophic Loss Reduction under the leadership of Paul Kovacs and Gordon McBean. The author is appreciative of the thorough reviews by Ron Stewart and Sudesh Boodoo that significantly improved the manuscript.
Dr. Paul Joe is a retired research scientist with Environment and Climate Change Canada specializing in severe weather, radar, nowcasting and forecast systems.
References
Ebert, E., L.J. Wilson, B.G. Brown, P. Nurmi, H.E. Brooks, J. Bally, and M. Jaeneke, 2004: Verification of nowcasts from the WWRP Sydney 2000 Forecast Demonstration Project. Wea. Forecasting 19, 73-96.
Elmore, K. L., Z. Flamig, V. Lakshmanan, B. Kaney, V. Farmer, H. D. Reeves, and L. P. Roth-fusz, 2014: mPING: Crowd-sourcing weather reports for research. Bull. Amer. Meteor. Soc., 95, 1335–1342, https://doi.org/10.1175/BAMS-D-13-00014.1.
Flossmann, A.I., M. Manton, A.A. Absaev, R. Bruintjes, M. Muakami, T. Prabhakaran and Z. Yao, 2019: Review of advance in precipitation enhancement research. Bull. Amer. Meteor. Soc., 1465-1480, DOI:10.1175/BAMS-D-18-0160.1
Gilbert, D. B., B. A. Boe, and T. W. Krauss, 2016: Twenty Seasons of Airborne Hail Suppression In Alberta, Canada. J. Wea. Mod., 48(1), 68-92. https://doi.org/10.54782/jwm.v48i1.551
Joe, P., D. Burgess, R. Potts, T. Keenan, G. Stumpf and A. Treloar, 2004: The S2K severe weather detection algorithms and their performance. Wea. Forecasting, 19, 43-63.
Joe, P. and D. Dudley, 2000: A quick look at the Pine Lake storm. CMOS Bulletin SCMO, 28, 172-180.
Joe, P., R.E. Stewart and S. Boodoo, 2024a: The Billion Dollar Calgary Hailstorm, Part I: Overview. CMOS Bulletin, TBD
Joe, P., R.E. Stewart and S. Boodoo, 2024b: The Billion Dollar Calgary Hailstorm, Part II: Explosive growth, merging and the meso-front. CMOS Bulletin, TBD
Lim, S., V., Chandrasekar V. , and V. N. Bringi, 2005: Hydrometeor classification system using dual-polarization radar measurements: Model improvements and in situ verification. IEEE Trans. Geosci. Remote Sens., 43, 792–801, doi:10.1109/TGRS.2004.843077.
Lu, Y., Y. Zhou, S. Zou, Z. Yang and Y. Zeng, 2023: The macro- and microphysical response characteristics of the multicell hailstorm hail-suppression operation: Case study. J. Appl. Met. Clim., 62(9), 1243–1262, DOI: https://doi.org/10.1175/JAMC-D-22-0129.1
Marshall, J.W.S. and W. Palmer, 1948: The distribution of raindrops with size. J. Met, 5(4), 165–166.
Morrison, H., M. van Lier-Walqui, A.M. Fridlind, W.W. Grabowski, J.Y. Harrington, C. Hoose, et al., 2020: Confronting the challenge of modeling cloud and precipitation microphysics. J. Advances in Modeling Earth Systems, 12, e2019MS001689. https://doi.org/10.1029/2019MS001689.
NWS, 2024: Hail Threat Defined, https://www.weather.gov/mlb/hail_threat#:~:text=Note%3A%20To%20be%20considered%20severe,golf%20balls)%20causing%20minor%20damage (accessed May 6 2024)
Ortega, K. L., J. M. Krause, and A. V Ryzhkov, 2016: Polarimetric radar characteristics of melting hail. Part III: Validation of the algorithm for hail size discrimination. J. Appl. Met. Climatol., 55, 829–848, https://doi.org/10.1175/JAMC-D-15-0203.1.
Park, H. S., A.V. Ryzhkov, D.S. Zrnić, and K.-E. Kim , 2009: The hydrometeor classification algorithm for the polarimetric WSR-88D: Description and application to an MCS. Wea. Forecasting, 24, 730–748, doi:10.1175/2008WAF2222205.1.
Thompson, E. J., Rutledge, S. A., Dolan, B., Chandrasekar, V., and Cheong, B. L., 2014: A dual-polarization radar hydrometeor classification algorithm for winter precipitation. J. Atmos. Oceanic Technol., 31(7), 1457-1481.
Pirani, F.J., M.R. Najafi, P, Joe, J, Brimelow, G, McBean, M, Rahimian, R.E. Stewart, P. Kovacs, 2023: A ten-year statistical radar analysis of an operational hail suppression program in Alberta. Atmos. Res., 295, 107035, ISSN 0169-8095, https://doi.org/10.1016/j.atmosres.2023.10.
Strong, G. S., B. Kochtubadja, P.W. Summers, J.H. Renick, T.W. Krauss, R.G. Humphries and E.P. Lozowski, 2007: 50th anniversary of hail studies in Alberta accomplishments and legacy. CMOS Bulletin, Special Issue, 35, 3-19.
Taylor, N. M., D. M. L. Sills, J. M. Hanesiak, J. A. Milbrandt, C. D. Smith, G. S. Strong, S. H. Skone, P. J. McCarthy, and J. C. Brimelow, 2011: The understanding severe thunderstorms and Alberta boundary layers experiment (UNSTABLE) 2008. Bull. Amer. Meteorol. Soc., 92, 739-763.
Witt, A. , M.D., Eilts,, G.J. Stumpf, J.T. Johnson, E.D. Mitchell. and K.W. Thomas, 1998: An enhanced hail detection algorithm for the WSR‐88D. Wea. Forecasting, 13, 286 – 303.
Wilson, J. W., N. A. Crook, C. K. Mueller, J. Sun, and M. Dixon, 1998: Nowcasting thunderstorms: A status report. Bull. Amer. Meteor. Soc., 79, 2079-2099.
WMO, 2016: Executive summary of the WMO statement on weather modification, https://wmoomm.sharepoint.com/:w:/s/wmocpdb/EZ-VHVw1NyZJtuGvhMp97-IBy40mW-UEtSjIDZpmVoVlRg (accessed 8 July 2024).
Calgary, hail, hailstorm, Paul Joe, radar analysis, storm, thunderstorm