
Fog over Sable Island
– By Li Cheng, Zheqi Chen, Peter Taylor, Yongsheng Chen and George Isaac –
Introduction
Marine fog occurs frequently offshore from Atlantic Canada. It can cause problems for helicopter flights to offshore worker from Newfoundland and any flights to the National Park on Sable Island, Nova Scotia as well as in many coastal communities along the East Coast. Fog is formally defined as visibility or Meteorological Optical Range (MOR) less than 1 km and mist is specified when 1 km < MOR < 5 km. Summer statistics (1971-2000 Climate Normals note 1981-2010 not available) from Sable Island show fog reported in 200 (out of 720 or 744) hours in June and July, although individual Sable Island A weather reports often indicate fog with visibility > 1 km. Isaac et al (2020) report fog from a platform on the Grand Banks occurring approximately 40% of the time in June and July from 20 years of METAR reports. Aborted flights to the Grand Banks or to Sable Island because fog prevents landing are inconvenient and accurately forecasting visibility conditions is a continuing challenge.
The initiation, development and decay of fog can involve many physical processes. The marine fog that is our focus arises as warm moist air, typically from over the Gulf stream, is advected over colder water, influenced by the Labrador current. The moist air cools as turbulent diffusion mixes heat down towards the water surface. Water vapour can diffuse up or down depending on the mixing ratio profile. When the relative humidity gets to 100% fog droplets will form. Radiation can play an important role. Once fog has formed, longwave radiation loss from the fog top can cool the upper fog layers, enhance mixing within the fog and create a stably stratified layer above.
Over the past year Wood Environmental and NSERC have supported research at York University using, and modifying the Advanced Research (ARW) version of the Weather Research and Forecasting (WRF) model developed at NCAR and widely used throughout the world. One test for our modelling work is how well our modelling matches the winds, temperatures and visibilities reported from the Sable Island A weather station. We found that the statement at the beginning of ECCC marine weather reports stating “Please note that these observations might not always be representative of weather conditions over their associated marine area” needs to be taken seriously as far as Sable Island fog is concerned.
Fog on Sable Island
On land, even on the narrow (~ 1 km) strip of sand that is Sable Island, heating of the ground by solar radiation and cooling at night via longwave radiation lead to diurnal changes in land surface and near-surface air temperatures which are greater than they are over water, where mixing in the upper water column reduces water surface temperature variations. At an inland site like Halifax Airport, the diurnal temperature cycle in July often spans 10 °C or more while on Sable Island it is more often 5 °C or less. Even so, with saturated or near-saturated air drifting in from the sea, and radiative cooling of the land surface at night, more water vapour can condense and a low-level radiation fog can occur or intensify, especially in light wind conditions. With strong winds and marine fog over the water being advected over Sable Island, even a small afternoon warming of the near-surface air in its 400 m path over the sand and bushes between the water and the YSA weather station could cause some evaporation of fog droplets and modify the visibility reported by the automatic weather station instrument relative to that over the surrounding ocean.
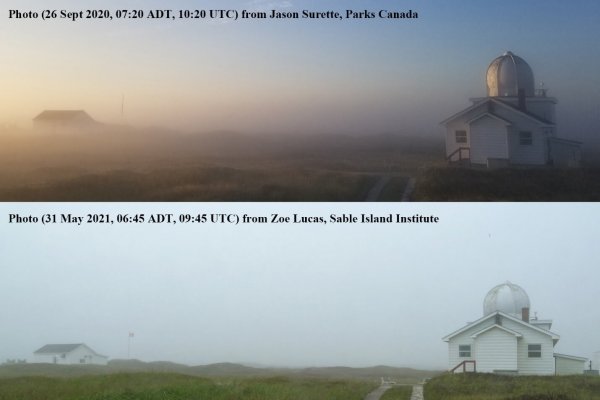
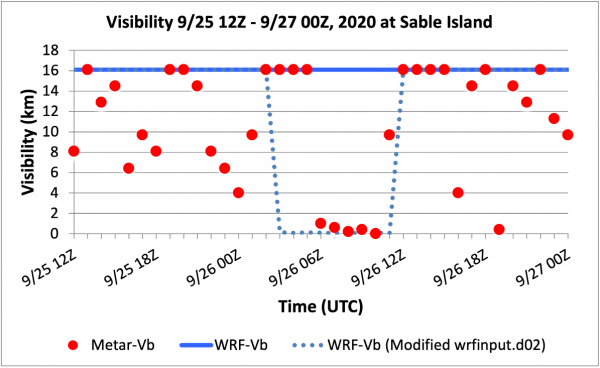
On one of the days shown in the two photos above (Sept 26, 2020), and from a study of weather reports for that day, it appears that winds were relatively light, fog formed at the weather station overnight but skies cleared by noon. In the distance, there would still appear to be fog or mist over the ocean in the distance. The fog did return later that day. Looking through historical weather data for Sable Island A we find many other days with similar time sequences. On other occasions, such as May 31, 2021, (shown above) fog or mist persists all day in Sable Island A reports although with increasing temperatures during the day; visibility there may be better than over the surrounding ocean.
We can also use the Hourly Data Reports to investigate whether there is a diurnal cycle in the frequency of fog occurrence. Figure 2 below shows the numbers of hours with visibility < 1 km and < 5 km for 6 years of July data (visibility data are not available in July 2020).
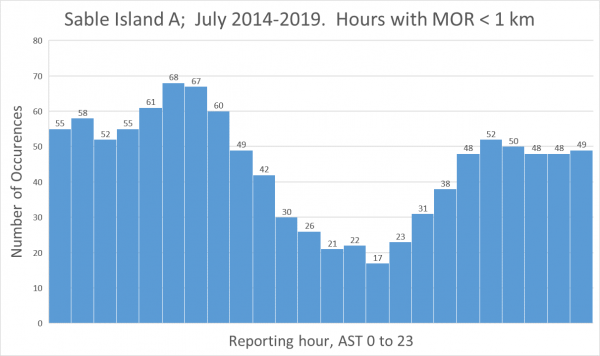
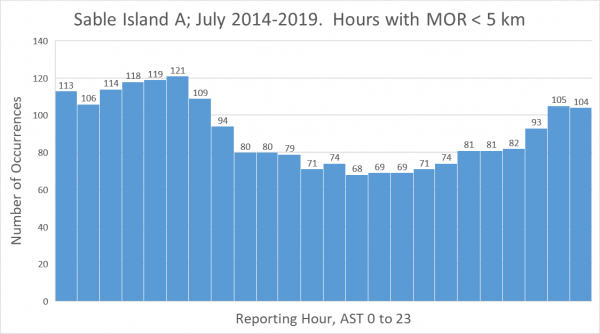
Using the strict < 1km definition of fog we see a pronounced diurnal cycle on Sable Island with a maximum occurrence near 37% around dawn and a minimum of 9% in the early afternoon. For visibility < 5 km, there is a less pronounced diurnal variation with 65% occurrence at 5 am (EST) reports and a minimum of 37% in the early afternoon. These reflect temperature variations at the land site in comparison with the open ocean situation where there is minimal diurnal variation in visibility, air or sea surface temperature. Isaac et al (2020), report on fog measurements (< 1 km) made over the Grand Banks on "Installation 1" over a 20-year period. There is virtually no diurnal variation in fog occurrence there.
The land surface clearly modifies temperatures and visibility at the Sable Island A site, about 400 m inland from the S shoreline, relative to open ocean conditions. Even at the shoreline, steepening and breaking waves could be an enhanced sink for fog droplets and a source of spray droplets affecting near-surface measurements of liquid water content and droplet size distributions.
WRF Modelling
WRF comes with many options to represent boundary layer mixing, cloud physics and radiation processes and it is important to select the best options. The modules used for the results presented below used MYNN boundary-layer treatment, Thompson microphysics and a modified fogdes scheme.
Once cloud droplets, typically in the size range 1-50 μm (see Isaac et al, 2020 for examples) have formed they will be subject to gravitational settling (typical velocities in the cm s-1 range) and this is represented within WRF. What is not generally included for marine fog is the added deposition to the surface associated with turbulent impaction, collision and coalescence of water droplets with the surface. Several weather forecast models combine fog liquid water and water vapour as total water, but we would argue that deposition and transfer processes of the two states (liquid or vapour) at water surfaces need separate treatment. We have added an optional process in our modified treatment of the boundary layer and surface interactions through a roughness length (z0c) concept in the turbulent mixing of fog liquid water and deposition to the surface. One consequence of this is that the underlying water surface then becomes a stronger sink for fog droplets and the liquid water concentration, and visibility can then vary significantly with height. In the results presented here we take z0c = 0.01 m.
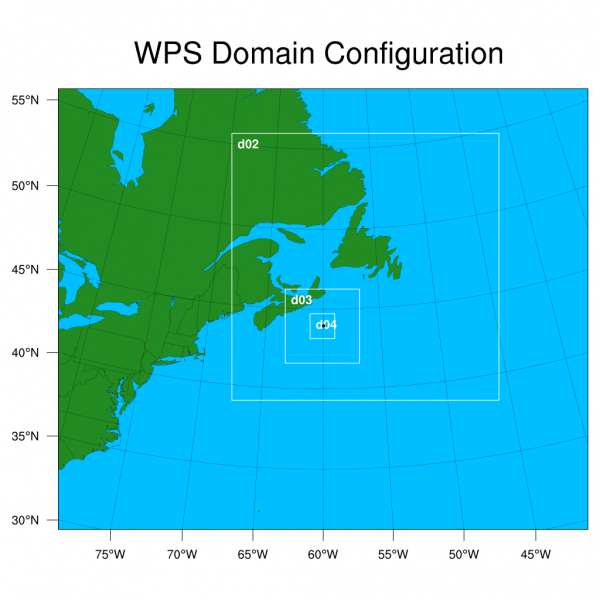
WRF was run with nested grids starting at 30 km. Figure 3 shows the domains used. For much of our work, and for practical computer resource considerations, we often only use domains 1 (the full figure) and 2, with a 10 km grid. In this case, Sable Island does not exist. We can however set one grid point as land to represent a 10km x 10 km island in the same location.
To illustrate the performance of the model Figures 4 – 6 show WRF temperature, fog water (Qc) and visibility results (hindcasts) for times around those shown in Figure 1; Sept 26, 2020, and May 31, 2021.
Sept 26, 2020
Visibility results shown in Fig 4 used nesting only to domain 2 and had one (10 km x 10 km) land point representing Sable Island. Even with that simple representation, WRF shows a reasonable match with the observations on Sable Island for 26 Sept 2020. According to our model Qc contours and vertical profiles, the fog is shallow, ~40 m and the surrounding grid points do not have fog. The model results support the idea that it is radiation fog. We have also made a high-resolution simulation (4 nested domains and 101 vertical levels). They take more computer time!
May 31, 2021 with High Resolution
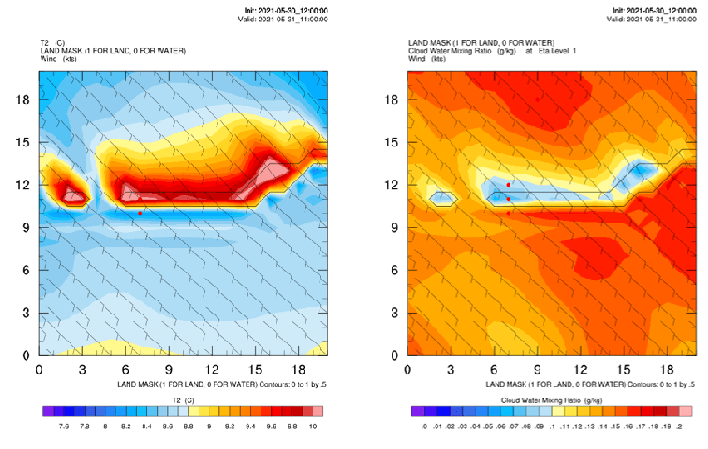
The contour plots shown in Figure 5 show winds from the SE, advecting cool temperatures and thick fog (LWC ~ 0.17 g/kg) on to Sable island at around 8 am ADT, about an hour after the photograph in Fig 1 and with visibility ~ 1.2 km (Fig. 6). The temperature at 2 m on the island is modelled as about 10 °C by WRF compared to about 8.5 °C upwind over the water. Weather station measured temperatures have risen from around 8 °C overnight to 10 °C by 8 am ADT. The air remains saturated as it is advected onto the island but Qc drops from about 0.16 to 0.08 g/kg.
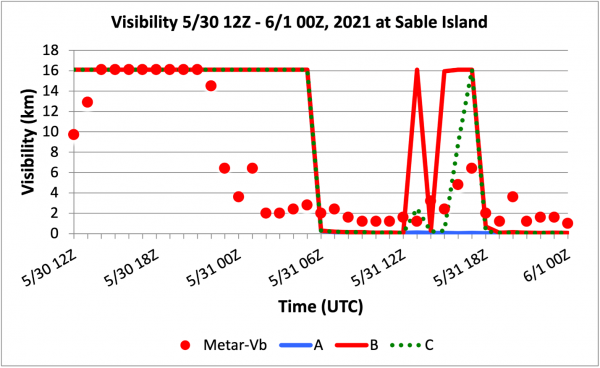
These are recent, preliminary, results but clearly illustrate that WRF has the capacity to simulate interesting details of fog at relatively high spatial resolution. For the 1 km wide Sable Island case even higher spatial resolution is desirable but with a 1.1 km grid, and a very simple representation of uniform-sized fog droplets we can get interesting results. Accurate determination of visibility reduction and timing is more challenging but Fig 6 shows the WRF simulation and weather station reports over our 36-hour simulation (which followed a 12-hour initial spin-up). The model run seems to miss fog 00Z-06Z on 31 May in Easterly winds, but tracks visibility (MOR) increases on the island (point B) and downwind (point C) between 12Z – 18Z in SE winds.
Fatima 2022
A research group led by Professor Harindra (Joe) Fernando from Notre Dame University have a major fog research program just getting underway. Fatima (Fog and turbulence interactions in the marine atmosphere) is a multi-year program funded by the US Office of Naval Research, Multidisciplinary University Research Initiative (MURI) program (ONR Grant: N00014-21-1-2296). Some initial details are at available here.
In addition to the core, MURI funded, participants, a number of Canadian groups are collaborating in the program, including a group of us from York and others from Dalhousie, UOIT, Wood Environmental and BIO. One component of a Fatima field program planned for summer 2022 is a series of measurements on Sable Island, subject to Parks Canada approvals. We are hoping to secure Canadian funding to be a significant part of this international effort.
Acknowledgements
This work has been supported through an NSERC Collaborative Research and Development grant (CRDPJ: 543476-19), with Wood Environmental and Infrastructure Solutions as the industry partner. We are very grateful for the involvement by Terry Bullock and his team at Wood. We also appreciate informative discussions about fog on Sable Island with Zoe Lucas (Sable Island Institute), Jason Surette (Parks Canada) and Gerry Forbes (ECCC), all of whom are very familiar with the island!
Li Cheng obtained her PhD in Physics at McGill University in 2005. She is now a Research Associate at York University. Her research area is on numerical modelling of marine weather including sea fogs and high wind conditions.
Zheqi Chen is a graduate student at York University, supervised by Peter Taylor and Yongsheng Chen. He has a background in atmospheric science from his undergraduate study at the University of Alberta. In York, he has been studying marine fog over Sable Island. In 2021 Zheqi received his master’s degree, but he carries on the research as a PhD student.
Peter Taylorhas been a Professor of Atmospheric Science at York University since 1988 when he moved there from the Boundary-Layer Research division of Environment Canada. Most of his research has involved atmospheric boundary-layer flows in complex terrain but his current research has broadened to include fog and other issues. Peter was on Sable Island conducting research as part of the Canadian Atlantic Storms Program (CASP I) in winter 1986.
Yongsheng Chen is an Associate Professor of Atmospheric Science at York University. He has extensive experience in numerical modelling and data assimilation for mesoscale weather prediction. He was one of the main developers of WRF/DART and WRFDA data assimilation systems. His recent research has been extended to atmospheric chemistry modelling using WRF-Chem and upper atmosphere modelling using WACCM-X.
George A. Isaac retired in 2013 as a Senior Scientist from ECCC after 40+ years of service. He formed a small company Weather Impacts Consulting and has continued doing research. He is also active as an Adjunct Professor at York University and Dalhousie University with their Atmospheric Science groups. Current projects include studying winter weather, aircraft in-flight icing, better methods for using weather radar data, and improving forecasts of high impact weather offshore Newfoundland and Labrador.