
The Billion Dollar Calgary Hailstorm of 13 June 2020, Part II: Explosive Growth, Merging and the Meso-Front
– By Paul Joe, Ronald E. Stewart, and Sudesh Boodoo –
Abstract
An overview of the Calgary billion dollar hailstorm of 13 June 2020 was previously presented. This extreme storm was attributed to the merger of two separate, less intense ones. The main storm (Storm B) was attributed to the synoptic environment and the second storm (Storm A2) was attributed to the mesoscale environment (meso-front) created by a mountain-plains circulation. Detailed observations and analyses are presented of the explosive growth phase of Storm B, the interaction and merging of the two storms and the interaction of the storms with the associated meso-front. This is to investigate and understand the mechanisms for the storm’s intense development and to identify the knowledge gaps.
1 Introduction
An overview of the 13 June 2020 hailstorm that struck northeast Calgary causing more than $1.2B of insured damages was presented in Joe et al. (2024), hereafter referenced as Part I. The storm (labeled Storm B) initially formed in south Calgary, grew explosively and moved northeastward. A surface boundary produced by the diurnal mountain-plains circulation, termed the meso-front, moved westward from the east of Calgary. A second storm (Storm A2) formed on this meso-front and merged with Storm B in northeast Calgary. Analysis of radar data indicated that the interaction of the synoptic and mesoscale air masses as well as the storm scale dynamics (i.e., inflows and gust fronts, precipitation processes) led to enhanced convergence resulting in intense convection.
In this contribution (Part II), we present a detailed analysis of Storm B: (i) from its initial weak convective to its explosive growth phase, (ii) during its merger with Storm A2, and (iii) its interaction with the meso-front. The objective of this analysis is to identify key mechanisms leading to the development of the intense convection.
2 Storm Phases and Features
2.1 Explosive Growth
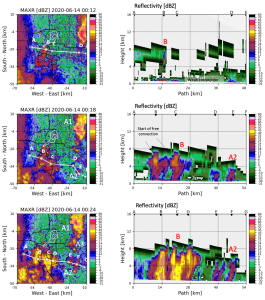
Figure 1 shows a sequence of images (0012, 0018 and 0024 UTC on 14 June, 2020) when Storm B initiated and then explosively grew. The figure shows MAXR (maximum reflectivity in a vertical column) maps and reflectivity cross-sections. At 0012 UTC (top panel), the cross-section shows weak convection to heights of less than 1 km AGL. This situation persisted for at least two hours (see Part I). At 0018 UTC (middle panel), the initial stages of Storm B were detected as a reflectivity feature aloft (∼ 5-6 km in altitude) with weak surface reflectivities (less than 30 dBZ) indicating that the capping inversion had eroded and the atmosphere was freely convecting in that location (south Calgary). At 0024 UTC (bottom panel), reflectivities greater than 40 dBZ have explosively increased in area producing heavy rain and perhaps small hail (< 2.54 cm) at the ground. This storm evolved from boundary layer convection to an intense thunderstorm in less than twelve minutes.
Figure 1 shows the development of Storm A1, A2 and A3 on the meso-front (see Part I). They had a different vertical structure compared to Storm B. While they all initiated at about the same time (0012 UTC), Storm B was taller and more intense than Storm A1, A2 and A3. Storm B developed aloft as a result of the unstable vertical thermodynamic structure whereas Storm A1, A2 and A3 were forced by the surface boundary-layer meso-front. These storms moved northwestward. Storm A1 bypassed Calgary to the north. Storm A3 merged with Storm A2 and the combined storm was designated as Storm A2, afterwards.
2.2 Storm Merging
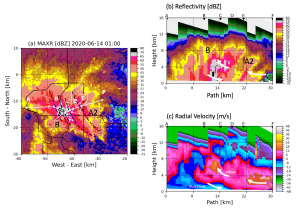
At 0100 UTC 24 June 2020, Figure 2 shows the MAXR (a) and cross-sections of reflectivity (b) and Doppler velocity (c). This shows the radar structure of the two storms just prior to merging. Storm B (Figure 2b) had reflectivities of greater than 55 dBZ at the ground that matched the damage survey, suggesting small to large hail (NWS, 2024). Greater than 70 dBZ echoes were observed aloft signaling the potential for large and very large hail in the next ten to twenty minutes. Storm A2 had a distinct tilt to the east with height, indicative of strong vertical shear due to the meso-front. The sounding showed steering winds at 700 hPa from 150° and low level winds from 55° (not shown). The Doppler data (Figure 2c) shows a gust front above the surface and a deep layer of inflow air at mid-levels (3-7 km).
In addition, at this time, a series of reflectivity bands, oriented northwest to southeast were observed (marked by dashed lines on Figure 2a). The cross-section control points (B, C, D and E) were located on these lines. These bands have a deep vertical structure with reflectivity cores greater than 55 dBZ and distinct echo tops (Figure 2b). Figure 2c shows a vertical cross-section through the Doppler velocity data. Positive values indicate radial velocities away from the radar and negative velocities indicate radial velocities towards the radar. Radial velocity data interpretations are ambiguous as only the radial component is measured and the cross-section has an arbitrary orientation. Using pattern recognition and expertise, a gust front from Storm B was identified as a deep (1-2 km) surface feature (white arrow pointing to the right in Figure 2b,c). Both storms (A2 and B) had strong inflow at mid-levels (between 3-7 km, white arrow pointing to the left).
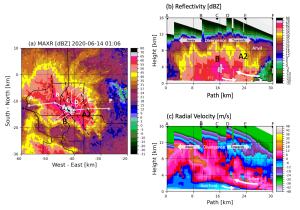
At 0106 UTC, Figure 3a,b shows that Storm B had diminished slightly but was still intense with maximum reflectivities of 65 dBZ. Figure 3c shows the gust front from Storm B had undercut and weakened Storm A2 by cutting off its inflow. At the top of the Storm B, a divergent Doppler signature in the anvil is seen, indicative of a very strong updraft.
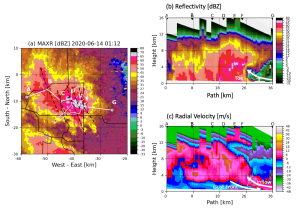
In Figure 4, 0112 UTC 14 June 2020, the convective lines were still evident (Figure 4a, black dashed lines). The two storms appear completely merged and labeled as Storm B as the merged storm track was consistent with its track. The reflectivity cross-section (Figure 4b) show a low level reflectivity toe from Storm B underneath Storm A2 suggesting that the downdraft was mature and intense, creating a cold pool. For the next three time cycles (0118, 0124 and 0130 UTC), the storms reached peak intensities with greater than 75 dBZ reflectivity cores (indicative of giant hail).
At 0124 UTC, the storm was at its peak intensity. Figure 5a,b show that there were two intense vertical cores connected by a horizontal core of reflectivities greater than 75 dBZ at 7-8 km AGL forming an inverted U-shape. This is unusual in several ways: (i) intensities of greater than 75 dBZ are rare, (ii) the volume or area of such high reflectivities is rare and (iii) an inverted reflectivity U-shape is uncommon.
The two intense vertical cores (marked as location B and E in Figure 5) are linked with intense thunderstorm downdrafts from Storms B and A2, respectively. Strong vertical downdrafts result in negative Doppler velocities towards the radar and are marked by solid white arrows and blue shades in Figure 5c. Associated updrafts are identified as columns of positive Doppler velocities and marked by yellow dashed arrows. The horizontal core joining the two vertical cores is hypothesized to be the result of hydrometeor growth processes along the mid-level inflow of air from Storm A2 into Storm B. However, this needs further investigation to confirm.
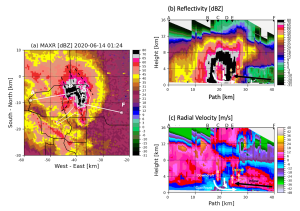
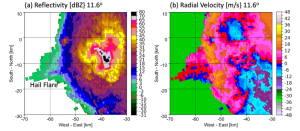
Figure 6 shows a hail flare which is a multiple scattering signature where the radar signal is reflected from the hail core down to the ground, then back to the hail core and then back to the radar. It arrives delayed in time and so it appears at a longer range from the radar. It indicates large and wet hail which is highly reflective and is a radar artifact used to diagnose the presence of large hail (Lemon, 1998; Wilson and Reum, 1988; Zrnic et al., 2010). In Part I, Figure 4c, a spike echo was observed due to reflections due to antenna sidelobe reflecting from the intense hail core.
2.3 The Meso-Front
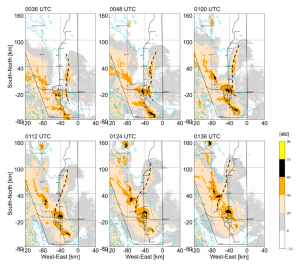
Figure 7 shows a sequence of MAXR images with an analysis of the position of the meso-front as it interacted with the merging (A2 and B, prior to 0112 UTC) and merged thunderstorms (B, the A2 label is dropped after 0112 UTC). The meso-front was approximately oriented in a north-south direction and moved slowly towards the west. Its position was deduced from the motion of reflectivity features (e.g. shape, orientation, centroid) in the MAXR product. It is a quasi-linear shape indicated by the dashed line in Figure 7 and appears to jump westward between 0100 and 0112 UTC. Possible explanations for the presence of these convective lines include that: (i) it was a continuation of the convective bands observed at 0036 UTC (Part I, Figure 2c) that developed through convergence; (ii) it was due to a pressure wave that was generated when the meso-front collided with the merged storms resulting in a jump in the position of the meso-front (Carbone, 1982); (iii) or, it may have originated with the pre-storm convective rolls (Weckwerth et al., 1997; Weckwerth et al., 1999; Wilson and Schreiber, 1986). The physical mechanisms responsible for this are unclear and further investigation is needed perhaps with idealized numerical simulations to provide physical insights.
3 Summary
A detailed examination of the rapid growth and merging phases of The Calgary Billion Dollar Hailstorm of 13 June 2020 as well as its interaction with a meso-front was presented.
The most intense of the thunderstorms (Storm B) was initiated and explosively grew in the southwest urban area of Calgary between 0012 and 0024 UTC 14 June 2020. Pre-storm weak convective rolls with heights of less than 1 km were observed in the prior two hours. Then, within a 12 minute period, several convective cells formed and became intense hailstorms.
Storm A2 formed at the same time (0012 UTC) but had a different character. It was shorter, less intense, formed from and likely was maintained by surface convergence along a meso-front associated with a diurnal mountain-plain circulation. Lines of convection were observed that may be attributed to convergence processes, a dynamic pressure wave or underlying convective processes. Further investigation is needed to understand the physical processes.
Storm B was the dominant storm. It was more intense, taller and produced strong gust fronts which undercut and lead to the demise of Storm A2. As the storms merged, the inflow air into Storm A2 and B combined at mid-levels (3 to 7 km), fueling and intensifying Storm B. The storms merged in north-east Calgary and resulted in a thunderstorm with extreme reflectivities greater than 75 dBZ, producing giant hail and heavy rain which lasted for about 20 minutes (0118 to 0130 UTC).
Merging thunderstorms are complex and result in storms with greater intensity. Studies that have been conducted on this issue illustrate the consequences and can include storm intensification although this does always occur (French and Parker, 2012; Sinkevich and Krauss, 2014; Wurman et al., 2007; Stalker and Knupp, 2003; Westcott and Kennedy, 1978). Further investigation of this phenomenon is warranted and, in this case, needs to consider multiple scales, complex topography, urban texture, and associated microphysical and dynamical processes.
This case also demonstrated the benefit of the improved observational capability of the recently upgraded Environment and Climate Change Canada radar network that collects full volume reflectivity, Doppler and polarization diversity data with little attenuation (S Band) at rapid cycles (6 minutes). This allows for: (i) identification of low level precursors to thunderstorm development (weak convective lines), (ii) earlier identification of convection aloft leading to imminent thunderstorm development, (iii) accurate identification of reflectivity features downstream of thunderstorms (due to less attenuation), (iv) comprehensive observations of dynamical severe weather (airflow) features throughout the thunderstorm volume (e.g., low level convergence, mid-level inflow and high level divergence), and (v) therefore, improved thunderstorm warnings.
Polarization was briefly discussed in Part I but its full exploitation is beyond the scope of this investigation. Although this radar based study led to critical insights, a more in depth analysis would also exploit surface, lightning, and satellite data and would utilize numerical modeling experiments to better understand the complex processes involved in this event .
4 Acknowledgement
The radar data for this study were provided by Environment and Climate Change Canada.
Dr. Paul Joe is a retired research scientist with Environment and Climate Change Canada specializing in severe weather, radar, nowcasting and forecast systems.
Dr. Ronald Stewart is a professor at the University of Manitoba where he carries out research on precipitation and extreme events. He has had a long career in academia and government.
Sudesh Boodoo is a weather radar research scientist at Environment and Climate Change Canada and a PhD candidate at Western University. He is also a member of the Northern Hail Project.
References
Carbone, R.E., 1982: A severe frontal rainband. Part I. Storm wide hydrodynamic structure. J. Atmos. Sci. 39: 258–279.
French, A.J. and M.D. Parker, 2012: Observations of mergers between squall lines and isolated supercell thunderstorms. Wea. Forecasting, 27, 2, 255-278, doi: 10.1175/WAF-D-11-00058.1
Joe, P., R.E. Stewart and S. Boodoo, 2024: The billion dollar Calgary hailstorm of 13 June 2020, part I: overview. CMOS Bulletin.
Lemon, L. R., 1998: The radar “three-body scatter spike”: An operational large-hail signature. Wea. Forecasting, 13, 327–340.
NWS, 2024: Hail threat defined, https://www.weather.gov/mlb/hail_threat#:~:text=Note%3A%20To%20be%20considered%20severe,golf%20balls)%20causing%20minor%20damage (accessed May 6 2024)
Sinkevich, A.A. and T.W. Krauss,2014: Changes in thunderstorm characteristics due to feeder cloud merging, Atmos. Res., 142(6), 124-132.
Stalker, J.R. and K.R. Knupp, 2003: Cell merger potential in multicell thunderstorms of weakly sheared environments: Cell separation distance versus planetary boundary layer depth. Mon. Wea. Rev., 131(8), 1678-1695, doi:10.1175//2556.1
Weckwerth, T. M., J. W. Wilson, R. M. Wakimoto, and N. A. Crook, 1997: Horizontal convective rolls:Determining the environmental conditions supporting their existence and characteristics. Mon. Wea. Rev.,125, 505-526.
Weckwerth, T. M., T. W. Horst and J. W. Wilson, 1999 An observational study of the evolution of horizontal convective rolls. Mon. Weather Rev., 127, 2160-2179
Westcott, N.E. and P.C. Kennedy, 1989: Cell development and merger in an Illinois thunderstorm observed by Doppler radar. J. Atmos. Sci., 46 (1), 117-131, doi: 10.1175/1520-0469(1989)046¡0117:CDAMIA¿2.0.CO;2
Wilson, J. W., and W. E. Schreiber, 1986: Initiation of convective storms at radar-observed boundary-layer convergence lines. Mon. Wea. Rev., 114 , 2516-2536.
Wilson, J. W., and D. Reum, 1988: The flare echo: Reflectivity and velocity signature. J. Atmos. Oceanic Technol., 5, 197–205.
Wurman, J., Y. Richardson, C.Alexander, S. Weygandt, and P.Zhang, 2007: Dual-Doppler and single-Doppler analysis of a tornadic storm undergoing mergers and repeated tornadogenesis. Mon. Wea. Rev., 135, 736–758, https://doi.org/10.1175/MWR3276.1.
Zrnic, D. S., G. Zhang, V. Melnikov, and J. Andric, 2010: Three-body scattering and hail size. J. Appl. Meteor. Climatol., 49, 687-700, https://doi.org/10.1175/2009JAMC2300.1.
Calgary, hailstorm, meso-front, Paul Joe, radar analysis, Ronald E. Stewart, storm, Sudesh Boodoo, thunderstorm