
A field laboratory class from home to study snow characteristics
– By Julie Mireille Thériault, Émilie Gauthier, Mathieu Lachapelle and René Laprise –
Learning atmospheric sciences
A degree in atmospheric sciences can lead to a variety of professions such as weather forecaster, climate analyst, field measurement specialist or a career in communications. It is, therefore, essential to provide students with training that uses the multiple approaches that reflect those career opportunities. This is the objective of the new undergraduate program in atmospheric sciences, implemented at UQAM in 2019 (Laprise and Thériault, 2019). The program includes three new laboratory courses on the topics of: (1) synoptic meteorology, (2) field measurements and laboratory experiments, and (3) numerical model simulations.
The laboratory class, which covered field measurements and laboratory experiments, was given for the first time during the winter 2021 semester. Given all the restrictions brought on due to the pandemic, this laboratory required a creative approach. Students were asked to collect data from around their homes during a winter storm. This meant that all the students documented the same storm and then analyzed the spatial and temporal evolution of the amounts and types of precipitation. These manual measurements were compared to automatic measurements. This approach proved to be successful and will likely remain as part of the course curriculum, with additional data collection in the field.
The goal of the field laboratory class
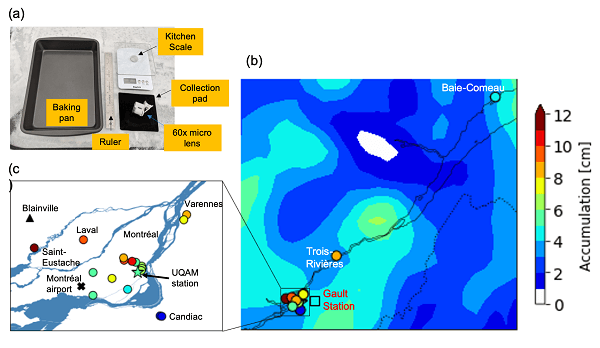
The goal of the laboratory is to teach students how to answer a scientific question according to the scientific method. Five experiments were conducted, during which students were asked to answer a scientific question using specific meteorological instruments as well as the manual data that were collected from their homes, located across the province of Québec (Fig. 1).
The weather station that is used is installed on the roof of the Université du Québec à Montréal (UQAM) President-Kennedy Building in downtown Montréal (Fig. 1). It is equipped with a standard thermometer, anemometer and precipitation gauge. Sophisticated instruments are also used at this station: an optical-laser disdrometer to characterize the size and fall speeds of precipitation particles, and a Micro Rain Radar to characterize the precipitation aloft.
In addition to automatic measurements, the students were given a 60x smartphone microscope, a baking pan, a kitchen scale and a ruler (Fig. 1). These were used to document snow crystals as well as to measure snow depth and density, as presented in Kumjian et al. (2020).
During their first experiment, the students learned how to use the smartphone microscope and how to perform manual snow measurements. The following three experiments focused on analyzing the data obtained from the meteorological instruments using the Python programming language. Basic computing codes were provided to the students using Jupyter Notebook to read and analyze the data. The last experiment was to conduct a case study by collecting precipitation data across Québec Province (Fig. 1) and analyzing the large-scale atmospheric conditions using ERA5 reanalysis data (Hersbach et al., 2020). The precipitation data that were collected included manual measurements of snowfall and snow particles, as well as documentation of the precipitation type, degree of riming, and degree of aggregation.
Finally, a group of students was responsible for producing daily weather forecasts to determine which event to document. Luckily, a snowstorm occurred at the exact time that the class was scheduled for the students in the Montréal area, but the storm occurred at a later time (after the storm passed) for those in eastern Québec.
Documented snowfall event
On 5 February 2021, an occluded front, first located over the Great Lakes region and associated with a low-pressure system, moved northeastward across the province of Québec. Precipitation started in the Montréal area at around 1430 UTC 5 February 2021 and reached Baie-Comeau 21 h later.
Up to 12.7 cm of snow was measured across the province by the students located in the Montréal area, Trois-Rivières and Baie-Comeau (Fig. 1). The measurements from the students varied from 2 cm to 12.7 cm across the Montréal region. The UQAM weather station single-Alter Geonor measured 5.4 mm in liquid water equivalent, whereas the Environment and Climate Change Canada station at the Montréal-Trudeau Airport measured 3.8 cm of snow. As another comparison, the ERA5 accumulated precipitation is shown in Fig. 1, with similar amounts of precipitation for the Montréal area (4–5 cm of snow).
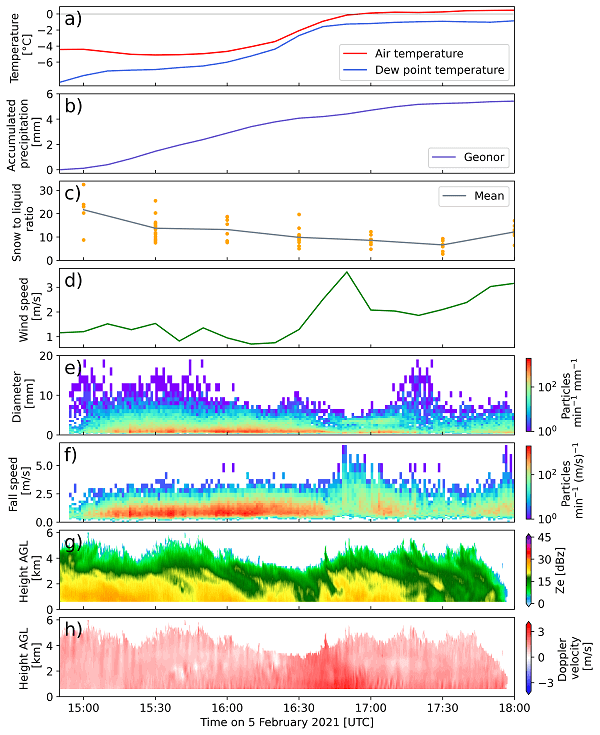
A range of accumulated snow was measured by the students. The snow density measurements from the Montréal area varied from 31 to 361 kg/m3, which corresponds to the range for snow-to-liquid ratio of 2.76:1 to 32.45:1 (Fig. 2). Spatial variation of snow accumulation in the Montréal area was obtained, which could be due to the local-scale variations or experimental errors such as whether the baking pan was placed in a windy environment or near vegetation. Higher precipitation amounts were measured west of Montréal and decreased to the east, from 12.7 cm in Laval to 7–8 cm in Varennes (Fig. 1). Stations located farther west were closer to the centre of the low-pressure system. Reflectivity measured by the scanning Environment and Climate Change S-band radar located in Blainville also showed spatial variability (not shown). Finally, snow density increased during the event, which is consistent with the increasing environmental air temperatures of -4.43°C to 0.47°C. Lower amounts of snow accumulation were measured in southern locations such as Candiac, where snow was reported to have melted.
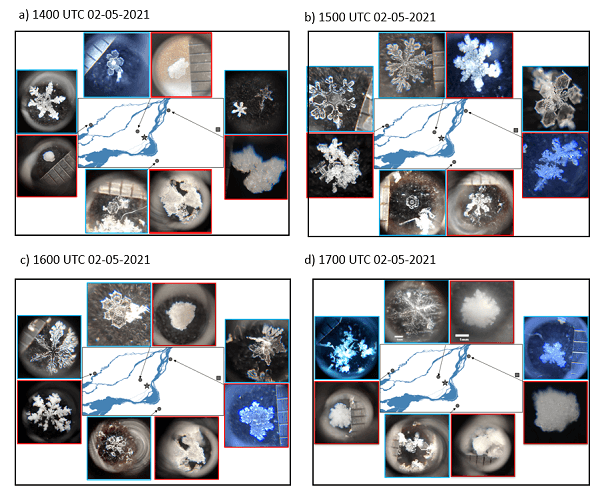
Many types of ice crystals were also reported by the students. Mainly dendrites, needles and plates were observed at the onset of precipitation, whereas smaller plates and snow pellets were reported at the end of the event. Students also reported the occurrence of rimed snowflakes during the event (Fig. 3). Less riming was observed at the start of the precipitation event over the Montréal area. At these locations, the degree of riming increased during the event until particles were completely rimed. Completely rimed particles referred to as snow pellets, were also reported by students in Montréal, Laval, Varennes and Candiac during the last hour of the event, when the environmental air temperature was at its highest, at 0.47°C. Overall, various degrees of aggregation (not shown) and riming were reported during the precipitation event.
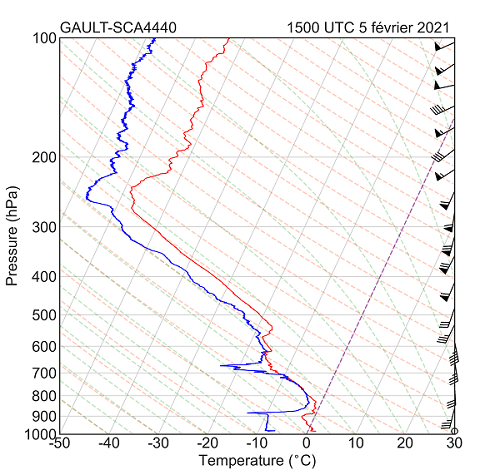
The sizes of the snow particles that were measured were compared with those from the OTT Parsivel laser-disdrometer and the vertically pointing radar (Micro Rain Radar, MRR) located at UQAM (Fig. 2). The particles measured by the disdrometer were between 0.2 mm and 20 mm, with an average of approximately 1 mm. This is the same range of sizes estimated by the students. Although smaller particles with various degrees of riming were predominant, all students also reported the occurrence of aggregated ice crystals. Several students reported large aggregates that were often too large to photograph with the micro lens. Growth by aggregation may have occurred, as suggested by the relatively constant particle Doppler velocity (~1 m/s) and the increased reflectivity towards the surface, as measured by the vertical-pointing radar at UQAM. The atmospheric sounding launched at 1500 UTC 5 February 2021 suggests relatively warm atmospheric conditions aloft, which are favourable for aggregational growth (Fig. 4).
The outcome
The 2021 winter term saw 19 students registered in the field measurements and laboratory experiments class, including one student from outside the program. Up to 500 microphotographs of ice crystals were collected across the province of Québec, from Montréal to Baie Comeau. Students learned how to conduct a small field research project by collecting and analyzing field data and summarizing the findings in scientific reports. In the future, the students will go one step further by designing an experiment and installing the instruments themselves to document atmospheric conditions during a storm.
Finally, students were well prepared for this laboratory as they had learned how to read and interpret synoptic weather charts, atmospheric soundings and synoptic-station data during their first laboratory class on synoptic meteorology. In addition to gaining experience in the field, the analysis of field data also taught students about winter weather phenomena (in this case). They can now look forward to learning more about the physical processes that are involved. The knowledge gained here serves as a good transition to the third laboratory class, during which numerical model simulations will be used to verify hypotheses that are related to either phenomenon observed during the second laboratory class or various atmospheric-related fundamentals that were covered in other courses. Together, these three laboratory classes provide key tools for studying atmospheric-related phenomena using a practical approach.
Julie M. Thériault holds a Canada Research Chair in Extreme Winter Weather Events and is a professor at the Department of Earth and Atmospheric Sciences at the Université du Québec à Montréal.
Émilie Gauthier is an undergraduate student in atmospheric sciences at the Université du Québec à Montréal and was registered to the class.
Mathieu Lachapelle is a PhD candidate in atmospheric sciences at the Université du Québec à Montréal and contributed to the experimental design.
René Laprise is the chair of the undergraduate program in Earth and Atmospheric Sciences and professor at the Université du Québec à Montréal.
Atmospheric Science field work, Atmospheric Science Undergraduate Program, Snow measurments, UQAM