
Arctic Regional Climate Centre Consensus Statement: TEMPERATURE
– By Gabrielle Gascon1, Katherine Wilson1, Marko Markovic1*, Adrienne Tivy1, Bill Appleby1, Vasily Smolyanitsky2, Valentina Khan3, Helge Tangen4, Eivind Stoylen4, Lene Ostvand4, Johanna Ekman5, Arun Kumar6 and Shanna Combley6 –
2019 Arctic Summer Seasonal Summary and 2019-2020 Arctic Winter Seasonal Outlook for Temperature
Arctic temperatures continue to warm at more than twice the global mean. Annual surface air temperatures over the last 4 years (2014-2018) in the Arctic have been the highest on record since 1900. The extent of winter sea-ice is at record low levels, and the volume of Arctic sea-ice present in the month of September has declined by more than 50% compared to the mean value for 1979-2018 . To support Arctic decision makers in this changing climate, the new Arctic Regional Climate Centre (ArcRCC) Network now provides climate consensus statements in May prior to summer thawing and sea-ice break-up, and in October before the winter freezing and the return of sea-ice. The role of the ArcRCC is to collaborate amongst Arctic meteorological and ice services to synthesize observations, historical trends, forecast models and fill gaps with regional expertise to produce these climate consensus statements. These consensus statements provide a review of the major climate trends of the previous season, and outlooks for the upcoming season for temperature, precipitation and sea-ice. They are released at Arctic Climate Forums (ACFs) with Arctic users in May, and through a virtual on-line ACF in October.
Highlights
A strong persistent high-pressure system over the Arctic region between June and August 2019 contributed to the above normal surface air temperature observed in the region. Above normal temperatures and drier-than-average conditions are forecast for all Arctic regions between November 2019 and December 2020.
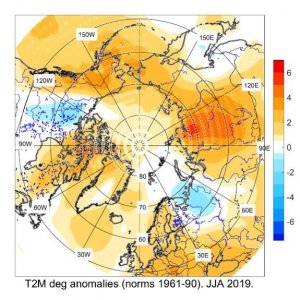
The summer 2019 (JJA: June, July, August 2019) average surface air temperatures were above normal for most of the Arctic domain, with Eastern Siberia experiencing its warmest JJA on record. Exceptions are north central Canada and the northwestern part of Russia, where average surface air temperatures were below normal. Above normal temperatures are expected to continue across the majority of the Arctic regions between November 2019 and January 2020.
Understanding the Consensus Statement
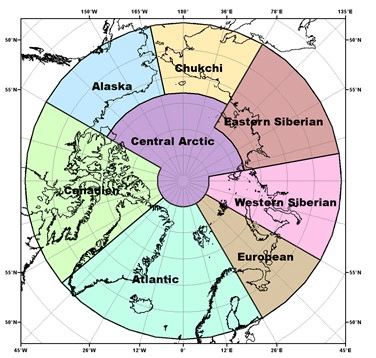
This consensus statement includes a seasonal summary and forecast verification for temperature for previous 2019 Arctic summer season. This statement also includes an outlook for the upcoming 2019-2020 Arctic winter season. Figure 1 shows the regions that capture the different geographic features and environmental factors influencing temperature.
The temperature forecast is based on thirteen WMO Global Producing Centers Long-Range Forecasts (GPC-LRFs) models. In terms of models’ skill (i.e. the ability of the climate model to simulate seasonal climate), a multi-model ensemble (MME) approach essentially overlays all of the separate model performances. This provides a forecast with higher confidence in the regions where separate models agree (regions where models have same result), versus a low confidence forecast in the regions where the models don’t agree. The multi-model ensemble approach is a methodology reputed as providing the most reliable objective forecasts.
Temperature Summary for Summer 2019:
The June, July and August (JJA) 2019 average surface air temperatures in the Arctic north of 65°N was above normal in most regions, with the exception of north central Canada and the northwestern part of Russia (Figure 2). Eastern Siberia saw their warmest JJA since the start of the record in 1936, while most of the Chukchi, Central Arctic, and Alaskan regions saw their second warmest JJA on record. Using data from NCEP/NCAR reanalysis to rank the average surface air temperature, the JJA period ranged from the top 10 warmest over parts of Alaska, Chukchi, the northern Canadian Arctic, and most of Eastern Siberia, to the 10th coldest in small areas of the western Canadian Arctic and northwestern Russia regions since the start of the record in 1949 (not shown).
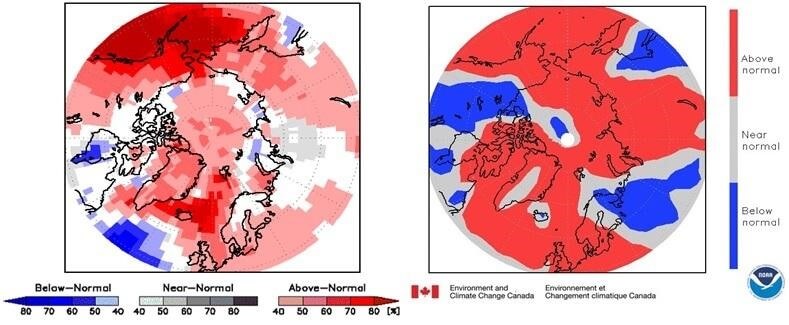
The Summer 2019 temperature forecast was verified by subjective comparison between the forecast (Figure 3, left) and re-analysis (Figure 3, right), region by region. A re-analysis is produced using dynamical and statistical techniques to fill gaps when meteorological observations are not available.
Above-normal surface air temperatures over western Alaskan, western Siberia, and the Chukchi region, were accurately forecast for the JJA 2019 season (Figure 3, Table 1). The above normal surface air temperature forecast for the northern Canadian region was also accurate. Over the Atlantic region, the forecast accuracies were variable but above-normal temperatures over the ocean for the region were accurately forecast. The observed below temperatures over eastern Alaska and the European region (blue areas in Figure 3, left) were not accurately forecast. Additional areas with an incorrect surface air temperature forecast included most of the Eastern Siberia, the southwestern parts of the Canadian Arctic, and eastern Alaska. As a general conclusion, the multi-model ensemble forecast was accurate for approximately 50-60% of the Arctic territory.
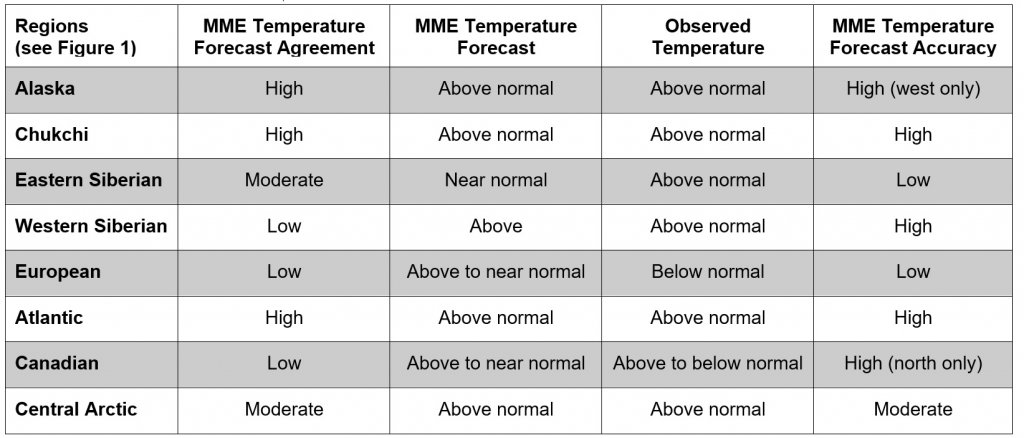
High=80%+, Moderate=50-70% and Low=<40%
Temperature Outlook for Winter 2019-2020:
Surface air temperatures during winter 2019-2020 (NDJ: November 2019, December 2019, January 2020) are forecast to be above normal across the majority of the Arctic regions (orange and red areas in Figure 4). The confidence of the forecast is moderate to low over most of the southern Arctic, especially over the southern continental Alaska, Canadian, European, Chukchi, Western and Eastern Siberian regions. (yellow and orange areas in Figure 4, Table 2). Forecast confidence increases with latitude from low/moderate to moderate/high for all regions (dark red areas in Figure 4, Table 2). The multi-model ensemble did not agree over southern Greenland (white areas in Figure 4).
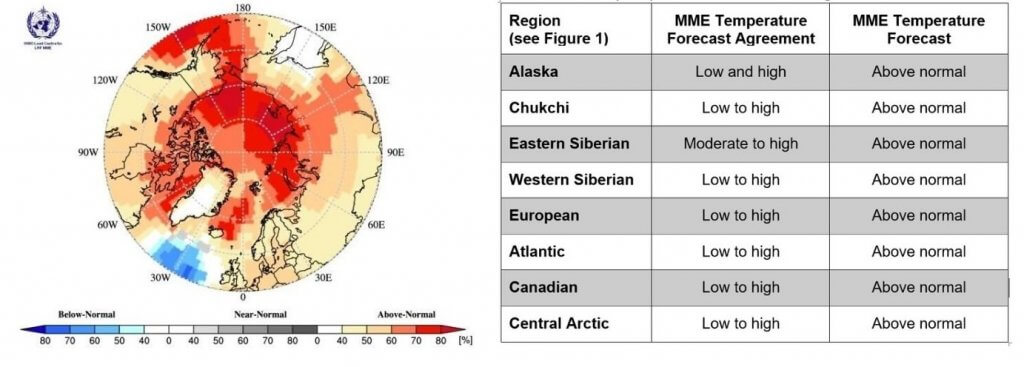
Right) Table 2: Winter (NDJ) 2019-2020 Outlook: Regional Forecasts for Arctic Temperatures
Background and Contributors
This Arctic seasonal climate outlook was prepared for ACF-4. Contents and graphics were prepared in partnership with the Russian, United States, Canadian, Norwegian, Danish, Finnish, Swedish, and Icelandic meteorological agencies and contributions of the Expert Team on Sea-ice, an expert team of the Joint WMO/IOC Technical Commission on Oceanography and Marine Meteorology, CCl/CBS Joint Expert Team on Regional Climate Centres, the Global Cryosphere Watch, the International Ice Charting Working Group, and with input from the Arctic Monitoring and Assessment Programme (AMAP).
The ArcRCC is in demonstration phase to seek designation as a WMO RCC-Network, and products are in development and are experimental. For more information, please visit www.arctic-rcc.org.
Author Affiliations:
1. Environment and Climate Change Canada
2. Arctic and Antarctic Research Institute, Russia
3. Hydrometeorological Centre of Russia, Russia
4. The Norwegian Meteorological Institute, Norway
5. Finnish Meteorological Institute, Finland
6. Climate Prediction Center, National Oceanic and Atmospheric Administration, USA
*About Marko Markovic, Corresponding Author:

Marko completed his PhD in atmospheric science at UQAM (2011) under the supervision of Dr. Hai Lin (RPN, Environment Canada). His PhD research encompasses seasonal forecasting and the research of low frequency atmospheric variability. After completing his doctoral degree Marko joined Consortium Ouranos as a postdoctoral fellow working on climate change related projects. Between 2012 and 2014, as a Consortium Ouranos employee, Marko has worked on the representation of the Arctic climate simulated by the latest generation of global climate models.
Marko joined ECCC in 2014 and his current work is focused on production and evaluation of seasonal forecasts, issued by Canadian Seasonal to Interannual Prediction system. Marko’s office is in Canadian Meteorological Centre (CCMEP) located in Montreal/Dorval.
More Like This:
ArcRCC, Arctic, climate outlook, Consensus Statement, Marko Markovic, temperature