
Radar Events Initiative
– By Phil Chadwick, Meteorologist and Eco-Artist –
Tenacity may be a good thing especially if it is well intentioned – the objective analysis of the weather services provided by Environment Canada. The following was written in 2004 to address some perceived deficiencies. The quality and quantity of radar were expanding and there were many imperative applications for that burgeoning information. The following were just a few of those and I had many more in the queue ready for implementation.
Now 15 years later I have not yet given up. A new generation of S-Band radars are being deployed across Canada offering much superior data that needs to be fully utilized as this 2004 research proposed. Acronyms and the organization of Environment Canada may have changed but the science of the natural world and the requirement to better understand weather and climate has become even more imperative.
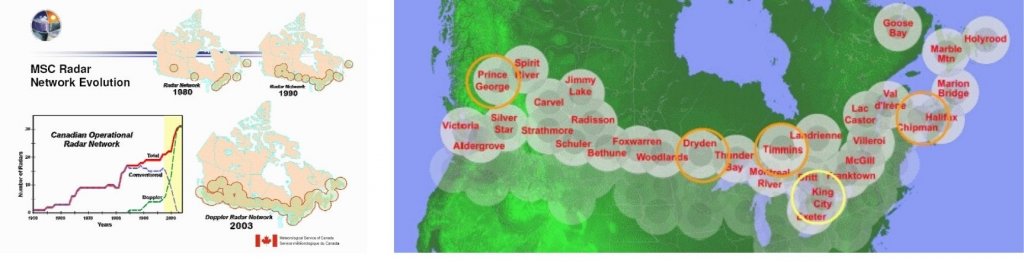
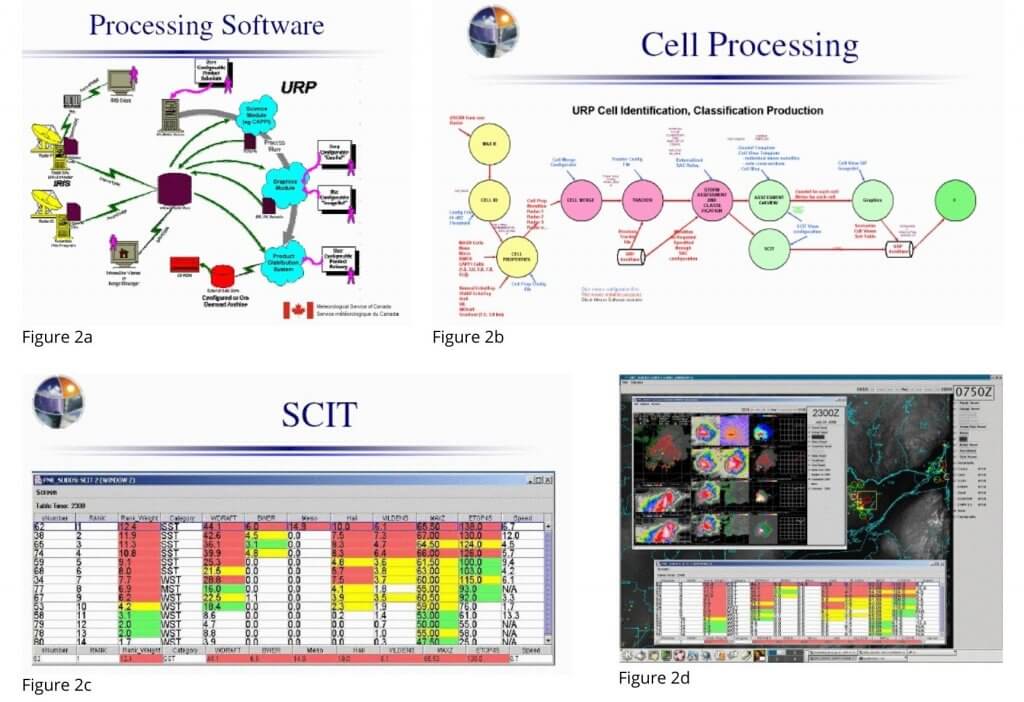
The National Radar Project (NRP) has deployed conventional and Doppler radars across southern Canada. An enormous volume of data is being produced in support of operational meteorology. Algorithms are applied to this data to aid the severe weather meteorologist in the identification of severe weather conditions. In the case of convection, many algorithms are used to quantitatively analyse the three dimensional volume scanned radar data. These algorithms also keep track of temporal changes in the calculated quantities. When the algorithms produce quantities exceeding predetermined thresholds, the time and place of the exceedance in the volume scan is identified as a convective cell. The quantitative exceedance for several convective quantities as well as a summary quantity are also tracked. This information is summarized in the Severe Convection Index Table (SCIT). These convective cells are tracked in time and space and used by the severe weather meteorologist as an aid in the warning program. (Figure 2)
These algorithms have been used since the initial updated radars were installed beginning in 2000. Unfortunately the SCIT data has never been archived and the algorithms for cell identification have never been calibrated. The creation of a “Radar Event” definition and this initiative is the first, very important step in addressing these concerns. This is also an important initiative in the use of remote sensing (radar) data to estimate a more accurate time and space distribution of severe convection. The information can also be used in performance measurement of the severe weather program.
Radar Events are convective events identified by the operational radar network. Events that occur within roughly 220 km of radar are assessed using conventional radar information while events that occur within 100 km of radar can be identified in both conventional and Doppler mode. Radar events can be mapped in time and space to produce a radar-based Severe Weather Events climatology associated with severe convection in Canada. When reported severe events are vetted and coincide with radar events, the algorithms used to quantify the severity of the radar events can be calibrated. There is much more that can be done with this data but the preliminary step is to archive the data required to quantify radar events. This information can then be used in severe weather prediction, climatology, algorithm calibration, event investigation, meteorologist training and evaluation and finally performance measurement. Some of these applications will be illustrated.
Concerns with radar artefacts and the accepted difficulties with radar remote sensing of the atmosphere must be noted. These include but are not limited to:
- Anomalous propagation
- Beam blocking
- Partial Beam filling
- Dome wetting
- Attenuation
- Non meteorological targets (birds and insects)
- Multiple trip echoes
The factors that can influence the returned radar energy to the radar are many and varied. However application of the radar event initiative offers considerable information that promises to advance the science of remote sensing and severe weather meteorology. As a result it is suggested that the radar events initiative proceed is spite of the noted difficulties.
It is important to state some preliminary definitions that are used throughout this research paper.
Report – An observation of a meteorological event at a specific time and place is a report. The report can only describe the characteristics of the event at that specific time and place and not the overall characteristics of the event.
Event – An event is the result of the merging of all reports that occur within the climatological time and space scale of a meteorological event. The start of the event is the start of the first report that was merged into the event. The end of the event is the end of the last report that was merged into the event. An event is defined by the phenomena creating it.
Radar Event – a radar event is the merging of all of the convective cells identified by radar that occurred within 30 minutes and 30 kilometres of each other. The 30 minute and 30 kilometres climatological scale of a convective event used here is a definition that has been used in Ontario Region since the inception of the Severe Weather Program. This somewhat arbitrary definition of the climatological scale of convective events is a good place to start. The highest values of the algorithms (SCIT data) determined for any of the cells merged into the single radar event, are used to characterize the radar event.
Radar Events Initiative – Details
The “Radar Events Initiative” incorporates:
- The Rank Weight and Component Severity Indices. The Radar Event is comprised of an overall event severity quantity (Rank Weight) as well as the severity of each of the convective weather elements that can comprise a convective event. These convective weather elements include hail, wind, rain and tornado. Each of these has an estimated severity or quantitative value based on the report algorithm. None of these algorithms have been calibrated or investigated. Plotting the severity or quantitative value for each radar report is a start in the calibration process.
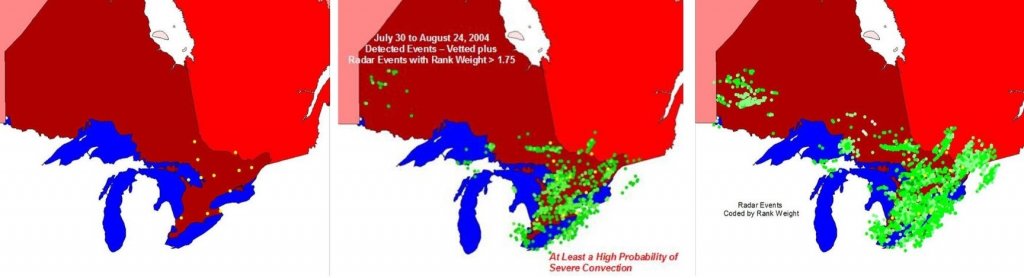
- The Temporal and Spatial Distribution of Convective Events. Mapping of the radar events in time and space provides a more accurate representation of the distribution of convective evens. The maps in figure 3 from August 2004 reveals the disparage between those 12 events detected by the official MSC observation network and those detected by radar. Certainly not all of the radar events are severe. However, it is also certain that many of the radar events did reach severe limits and produced damage in areas where that damage was not detected through the traditional MSC observation network.
- Performance Measurement. The use of radar events in performance measurement allows the estimate of the actual range in performance scores as well as the most likely performance values.
- Meteorological Training. The use of radar events will aid in the training and evaluation of severe weather meteorologists. Briefly, meteorologists can learn meteorological patterns that later result in severe convection. They will be better prepared to issue messages for those patterns while not issuing for those that do not result in severe convection.
Radar Events Initiative Examples
The above examples are all for the same time period in August of 2004. Only twelve (12) severe weather events were detected (reported or observed) during the 30 day study period. The radar network identified many more convective cells with potential severe signatures. Certainly not all of the 3000 radar events identified from these convective cells produced damage at the surface but it is also certain that some of them did. The mapping of the radar events gives a more accurate distribution in time and space where possible severe weather may have had an impact on the Canadian society. These graphics are for the entire 30 day study period but can also be produced for any temporal and spatial subset of the study. Given the proper software applications, these events can be interactively queried for specific information including the Rank Weight and the severity of the individual weather elements.
By comparing the radar signatures with co-located detected (MSC observed) events, one can calibrate the radar algorithms and establish radar rank weights which are highly correlated with damage at the surface. The volume scan signatures for the specific weather element comprising the severe convection event can also be calibrated in addition to the rank weight. The calibration of the Rank Weight and the related algorithms is essential in order to increase their utility to the severe weather meteorologist.
The location of these radar events and severe weather element quantities can then be mapped in time and space.
Illustrations of Concepts
The following graphs and accompanying text illustrates just some of the concepts that can be applied using the Radar Events Initiative.
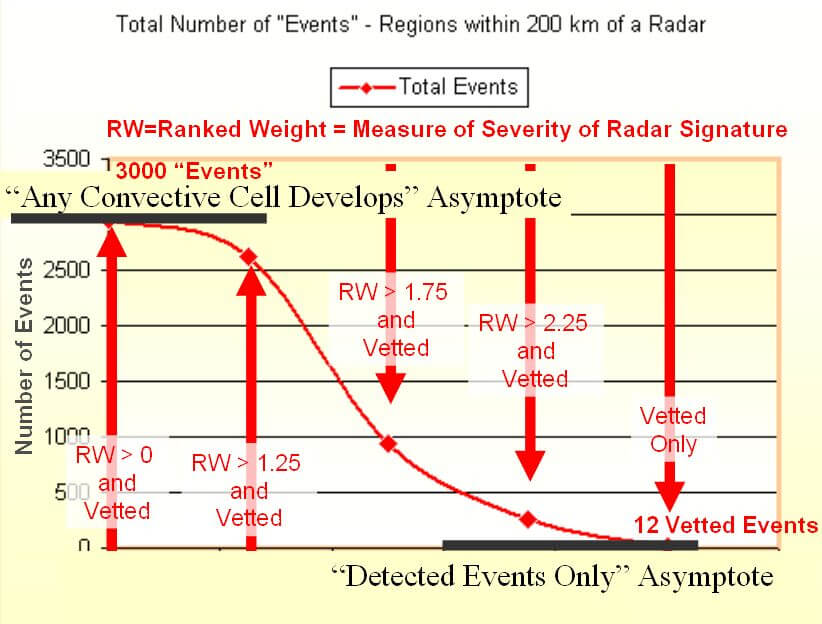
Figure 4 illustrates how the number of radar events identified by the NRP radars varies with Rank Weight. The radar events included in each of the five data sets is determined by the Rank Weight of the radar events. The first data set includes all of the 3000 radar events identified by radar. The second data set includes only those radar events with a Rank Weight greater than 1.25. Subsequent data sets are constructed using ever higher Rank Weight thresholds. The fifth and final data set includes only the 12 vetted events detected through the official MSC observation network.
The relationship between Rank Weight and the severity of the convective events is unknown at this point and is a major motivation for this paper. As labelled in the graphic, it is presumed that the probability that a radar event reaches severe thresholds increases with the value of the Rank Weight. The convective cell severity is certainly qualitatively related to Rank Weight but a quantitative relationship is required in order to glean the maximum amount of information from the NRP radar network.
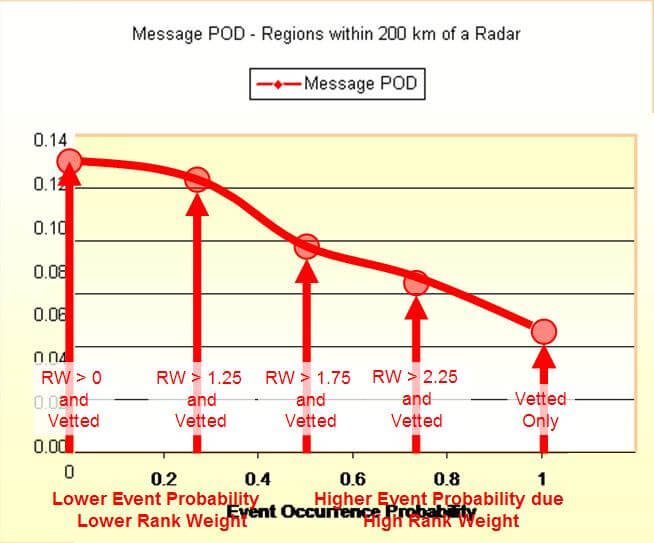
Figure 5 illustrates the five distinct data sets used in this study and the rank weights of the radar events that were included. The Probability of Detection (POD) is determined for each event data set. Note that the POD steadily increases as more radar information is included. The relative slope of the POD segments is very important. The absolute value of the slope of the POD segments is purely a function of the Rank Weight Thresholds selected. For maximum utility, the Rank Weight must be calibrated in terms of severity.
Some examples of how this information may be used, are described as follows using this 30 day data set to illustrate the concepts.
Figure 6 illustrates the relationship between the message based POD and the various event data sets that include radar events with specific Rank Weight thresholds. The use of this information can give much better estimates of the actual performance of the severe weather program. This graph clearly illustrates the upper and lower estimates of message based POD for the 30 days in August 2004.
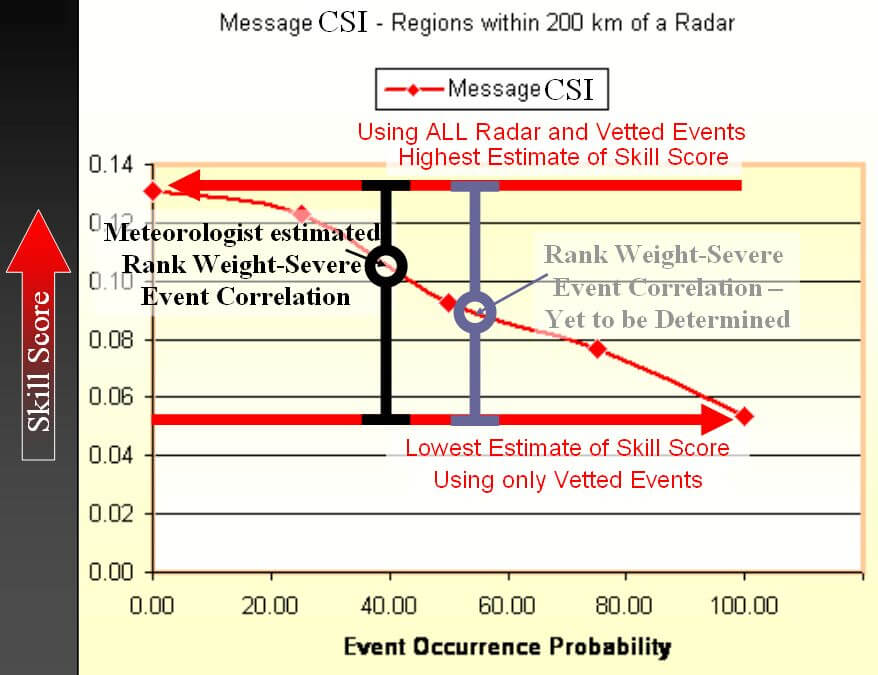
It is proposed that the above information be displayed as a “whiskers plot” with the extreme high and low PODS being the extreme whiskers. Initially the central POD value plotted would be located at the point of inflection in the POD trace which is the point where the severe weather meteorologist believes that the transition from non-severe to severe convection occurs. The graphic illustrates this whiskers plot in “black”.
After calibration of the Rank Weight, the most probable message based POD is found at the point where the Rank Weight of the convective events is most correlated with the transition from non-severe to severe convection. The graphic illustrates this whiskers plot in “gray”.
Conclusions
Radar events calculated from volume scan data can be used:
- to produce higher resolution temporal and spatial distributions that augment the climatology of severe events determined solely from detected (MSC observed) events;
- in performance measurement to estimate the actual range of skill achieved by the severe weather program;
- to calibrate the Rank Weight associated with severe weather in order to estimate the most probable performance measurement score;
- to aid the severe weather meteorologist in the consistent evaluation of severe weather patterns;
- to aid in the training and evaluation of severe weather meteorologists.
About the Author

Phil trained at Queen’s University as a nuclear physicist, “Phil the Forecaster” has been a professional meteorologist since 1976. However, painting has always been his passion. Phil is an avid “plein air” painter when he’s not doing severe weather prediction for Environment Canada or looking after nature on Singleton Lake.
More like this:
national radar project, Phil Chadwick, radar events, S-band Radar, severe weather