Synoptic-scale weather patterns associated with extreme precipitation regimes during the eastern North American winter
– By Yeechian Low –
Introduction and Motivation

Long-duration wet periods composed of a succession of multiple precipitation events produce a much larger impact than individual precipitation events, given that total precipitation is proportional to both precipitation intensity and duration (Doswell et al. 1996). However, there has been a relative lack of studies on the meteorological features and physical mechanisms associated with these periods on a climatological basis, with a few exceptions (Moore et al. 2021, Jennrich et al. 2020, Barton et al. 2016). A better understanding of the large-scale physical mechanisms leading to the occurrence and longevity of these periods could help improve prediction of these periods on the subseasonal-to-seasonal (S2S) time scales (Jennrich et al. 2020).
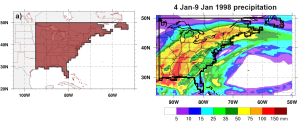
Our study aims to analyze extreme precipitation regimes (EPRs) in a new, more comprehensive manner by expanding the work on precipitation events to include extreme, long-duration, and large-scale precipitation periods during the eastern North American winter. More details of the study are presented at Low et al. 2022 and Low et al. 2025. We define EPRs as periods of extreme precipitation over eastern North America (Figure 1a) during winter persisting for at least 5 days, except allowing for one-day breaks as long as at least two-thirds of the days have extreme precipitation. With this methodology, we find 132 EPRs from the winters of 1940-41 to 2021-22. These events often produce large societal effects in the eastern U.S. and Canada. According to the Canadian Disaster Database, three Canadian weather disasters causing >$100 million in damages (the historic January 4-9, 1998 eastern Canadian ice storm, with total precipitation map in Figure 1b; the January 13, 1999 Toronto snowstorm; and the February 10, 2001 Quebec winter storm), as well as many other disasters of lesser magnitude, are associated with EPRs. Though not listed as a disaster by itself, a very unusual sequence of 3 EPRs in February 2019 cumulatively led to a winter of record snowfall in parts of Ontario and Quebec (Blunden et al. 2020) that contributed to extensive spring flooding in April and May that was listed as a disaster.
EPR weather pattern
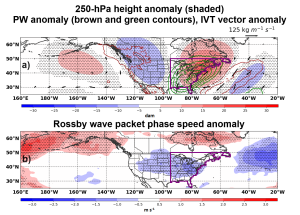
EPRs are characterized by slow-moving (shown in Figure 2b) anomalous upper-level ridges in eastern North America and the central North Pacific and an anomalous upper-level trough in western North America (shown in Figure 2a). An anomalous upper-level ridge (trough) refers to an area of anomalously high (low) pressure and warm (cold) air aloft respectively. The deep-layer air flow from the south and large-scale ascent between the trough in western North America and ridge in eastern North America is favorable for intrusions of moist, tropical air in eastern North America and anomalously frequent cyclones from the central U.S. northeastward into Atlantic Canada (Figure 3b) that deposit the moisture as heavy precipitation, consistent with Mercer and Richman (2007) and Bentley et al. (2019). The condensation of moisture as it ascends in cyclones leads to mid-tropospheric warming that enhances the ridge just to the east, creating a positive feedback loop (e.g. Archambault et al. (2010), Grams et al. (2011), Steinfeld and Pfahl (2019)) that contributes to the longevity of EPRs. There are also anomalously frequent cyclones near and especially just east of the Kamchatka Peninsula (Figure 3a), west of the central North Pacific ridge, and the positive feedback loop could also play a role there, though this is less obvious due to greater case-to-case variability.


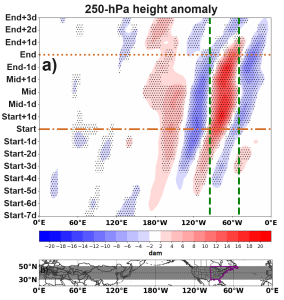
In contrast to the time-averaged plots in Figure 2, Figure 4a shows the weather pattern evolution throughout the EPR’s life cycle. If we find a strongly anomalous weather pattern preceding the EPR, we can have a heads-up on whether an EPR is likely to occur in the future based on the current weather pattern. However, a little surprisingly, there are only weak anomalies until a few days before the EPR starts, presenting a predictability challenge. A few days before the EPR starts, a weak upper-level ridge appears in the central North Pacific, along with a downstream trough near the West Coast and a ridge just east of the Rockies. The weather pattern strengthens and moves eastward until the EPR start, when it matches the favorable EPR pattern shown in Figure 2a. Then, it slows down and stays persistent until just before the EPR ends, likely at least in part due to the positive feedback loop mentioned earlier, and then moves faster eastward by the EPR end, when heavy precipitation ends in eastern North America. Consistent with downstream propagation of weather patterns from west to east from the North Pacific to North America (Winters et al. 2019), the central North Pacific ridge first breaks down before the EPR end, and then the eastern North American ridge breaks down.
A moisture budget analysis (Figure 3c) shows that there is a large net influx of water vapor into eastern North America before heavy precipitation begins, leading to a net moistening of the atmosphere before and at the EPR start. Then, heavy precipitation balances out or slightly exceeds the moisture influx until the EPR end, when a net outward moisture flux and remaining precipitation leads to a net drying of the atmosphere, ending the precipitation shortly afterward. This evolution corresponds with the weather pattern moving eastward to a favorable configuration for moisture transport and precipitation in eastern North America by the EPR start, then moving very slowly until almost the EPR end, and then moving faster away from the favorable configuration afterward.
EPR longevity
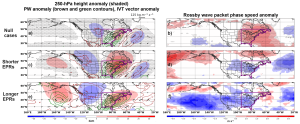
To ascertain contributors to the longevity of EPRs, we compare three sets of cases: precipitation events of a duration of 1-2 days (null cases, which do not meet the duration criterion for EPRs, Figure 5a and 5b), EPRs of duration of 5-9 days (shorter EPRs, Figure 5c and 5d), and EPRs of duration of 10+ days (longer EPRs, Figure 5e and 5f). In the null cases, the weather patterns are weaker than during shorter EPRs and have a shorter spatial wavelength (Figure 5a vs 5c), especially in eastern North America, which means that they would propagate more quickly to the east (Hoskins 1985), which is confirmed in Figure 5b. On the other hand, the weather pattern in the North Pacific, not so much over North America, distinguishes shorter from longer EPRs: the longer EPRs have a stronger central North Pacific ridge extending farther north into Alaska, as well as stronger moisture transport in the North Pacific, compared to shorter EPRs. The longer EPRs feature substantially slower-moving weather systems over the central and eastern North Pacific than shorter EPRs.

Conclusions and future work
To summarize, extreme precipitation regimes (EPRs) during the eastern North American winter are associated with a persistent weather pattern favoring southerly transport of moisture into eastern North America that is deposited in frequently occurring cyclones as heavy precipitation. The weather pattern in both North America and upstream in the North Pacific is important to the occurrence and longevity of EPRs. A positive feedback loop through condensational latent heating in and just to east of cyclone centers and to the west of upper-level high pressure systems helps to slow down and maintain the weather pattern, contributing to the EPR’s longevity.
In the future, we aim to perform a case study on a particularly long-duration EPR or a succession of EPRs as well as analyze numerical model performance of EPRs. We wish to compare the characteristics we find in the case study with those in the composite and discern the meteorological patterns and associated physical processes that render it particularly long-duration and impactful. Such analyses would help forecasters be on the alert for potential impactful wet periods in eastern North America if they recognize the precursors usually seen before EPRs, as well as to better use numerical model output in their forecasts.
On June 3-6, 2024, the 58th annual Canadian Meteorological and Oceanographic Society Congress was held virtually with help from the Winnipeg Centre and the BC Interior-Yukon Centre. The theme of the Congress was “Extreme Events in a Changing Climate,” wherein session topics spanned the latest science and solutions on the climate emergency to high impact weather and the global water crisis, among others. More information on the Congress can be found here.
To highlight the diverse and impactful research presented, we asked session chairs to choose one talk or poster to share with the Bulletin. This article is part of the series of Outstanding Presentations at the Congress.
CMOS Congress, CMOS Congress 2024, EPR, extreme precipitation regimes, North America, precipitation, Yeechian Low
