
Verification of Summer 2022 Canadian Temperature Forecasts from Four Different Organizations
– By George Isaac –
Introduction
The Canadian Public has access to weather forecasts from many diverse sources. However, it is difficult for the user to know the accuracy of such forecasts, or which is superior. To illustrate the need and difficulties of such a forecast verification, a study was performed to look at summer daily maximum temperature forecasts produced by Environment and Climate Change Canada (ECCC), MSN Weather (Microsoft), Weather Underground, and the Weather Network. Locations across Canada were selected for the study which included: Halifax, Montreal, Toronto, Barrie, Calgary, and Vancouver. Barrie was selected because it was near the author’s residence, and the others were selected because they were major cities near airports with good observation sites. The maximum temperature was selected as the variable because it is forecast and observed. Other variables such as minimum temperature, rainfall, cloud cover, dewpoint, or relative humidity, all have difficulties associated with them in terms of verification. For example, daily rainfall amounts are not forecast by some providers, at least in terms of the availability on public sites.
It is difficult to find papers that compare different forecasts for cities or points in Canada. Stuart et al. (1983) did a study emphasizing the city of Toronto and showed that maximum temperature forecasts did not improve over the period 1960-1979. Isaac et al. (2014a, 2014b) did studies for Vancouver and Toronto International airports, as well as sites for the Vancouver Olympics, but did not compare public forecasts. These studies showed how statistical significance tests can be used in forecast verification, but such robust tests were not used here, as will be briefly explained later.
All the observations were from the ECCC corresponding sites on their Webpages. For the summer period being analyzed, there being very few unusual temperature trends, the maximum temperatures occurred during the daytime. An attempt was made to verify the mimimum temperature, but forecast providers forecast the “tonight” temperature and it is not clear this means the minimum temperature.
For the forecasts between 22 June to 23 September 2022, the morning forecasts of that day were copied into a spreadsheet. ECCC only produces on their public site, forecasts for 7 days, while the others tend to emphasize 10 days or more. For Microsoft, Weather Underground, and the Weather Network, only forecasts to Day 10 were used.
For the ECCC public forecasts, their in-house numerical weather prediction models are used. Microsoft, Weather Underground, and the Weather Network use a variety of weather models and proprietary software. Weather forecasting is becoming “big business.” For example, Weather Underground is owned by IBM. However, how forecasts are produced, and how they are quality controlled is unknown to the normal user. Considering the importance of accurate forecasts, this increases the need for independent verification of their products.
Does the Forecast Site Represent the Observation Site
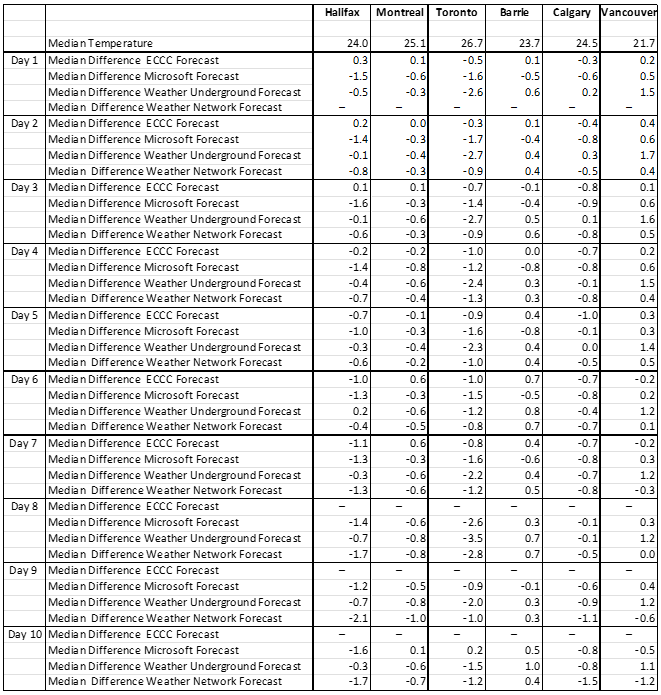
Often forecasts are produced for locations like Toronto and Vancouver where there are substantial variations in terrain, with nearby large bodies of water. The forecast providers do not indicate the exact location for which they are forecasting. One way to check if the airports are suitable sites for verification is to determine the forecast bias, or in this case the median difference between the forecast and observed maximum temperatures. Ideally this value should be 0oC at least for Day 1 and Day 2. Table 1 shows the median differences between observed and forecast temperatures for the Day 1 to Day 10 forecast. Day 1 indicates the morning of that same day. For Day 1 and Day 2, the differences are below 1oC for Montreal, Barrie, and Calgary. For the ECCC forecasts, the differences are less than 1oC for all locations in Day 1 and Day 2. However, for the Microsoft, Weather Underground and Weather Network, there are indications that the observation site at some locations (Halifax, Toronto, and Vancouver) may not correspond to the forecast site. This will be discussed further. Table 1 also shows that the maximum temperature median difference values are generally within 1oC for all forecast providers for Montreal, Barrie, and Calgary for Day 1 to Day 10.
“Accuracy” of the Maximum Temperature Forecast
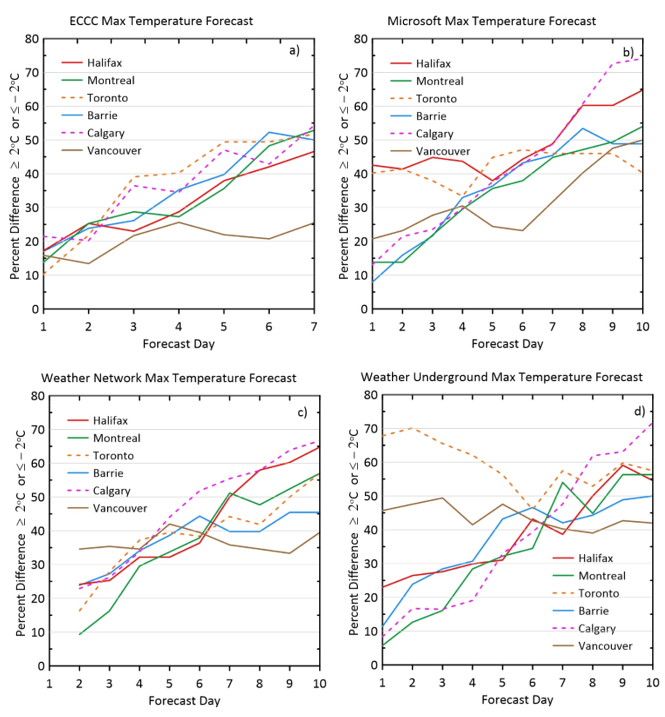
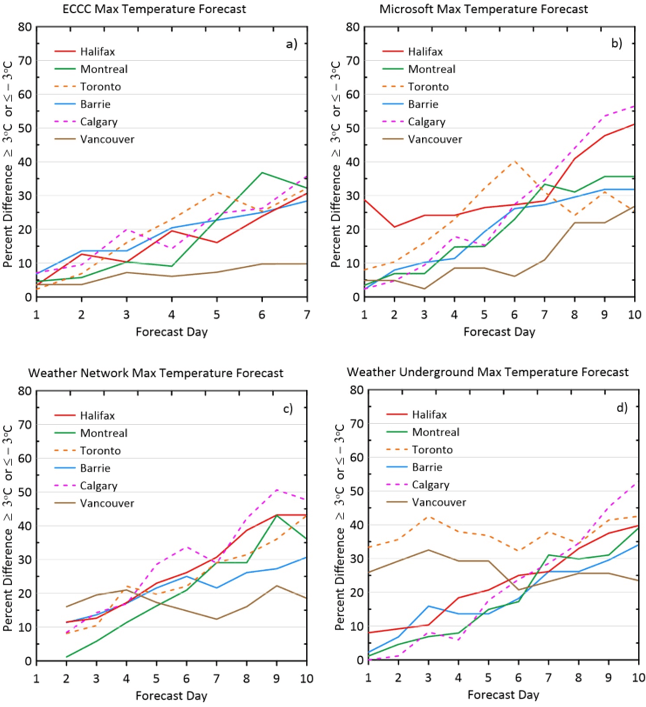
For this discussion, the accuracy of the forecast is described as the percentage of forecasts with differences between forecast and observations greater than plus or minus a specified number. This is an easy-to-understand parameter. For this analysis, forecasts with errors greater than 3oC are considered poor while those within 2oC are quite acceptable. Figure 1 shows the percentage of ECCC, Microsoft, Weather Network and Weather Underground forecasts greater than 2oC of the observations at the corresponding airport observation site. Figure 3 shows the same but for forecasts beyond 3oC of the observations.
Generally, the percentage of forecasts outside of a difference of 2oC or 3oC increases with forecast lead time. For the four forecast providers, at Forecast Day 7, the percentage with errors greater than 2oC, is about 40-50%. However, for ECCC for Vancouver, that error is closer to 25% at Day 7. Some locations and providers have unusually high errors for Day 1 to Day 3 forecasts, for example Halifax and Toronto (2oC only) for Microsoft, and Vancouver and Toronto for Weather Underground. This suggests that the models for those locations may not be forecasting for the airport observation site. If temperature forecasts with errors less than 2oC are acceptable, then the forecast providers are providing useful forecasts even at Day 10 where most forecasts are within that range (Figure 2).
Summary
It should be stated that this study represents only one summer season for one year. As such it is a limited sample. It would be difficult to indicate that one forecast provider is better than another. This is especially true since only temperature is being considered, not relative humidity, precipitation, and winds which can be considered the other primary forecast variables. Another caution is that forecast providers are constantly improving their products, so what happened in 2022 cannot be easily transferred to future years. However, the study is relatively unique in that it examines four different public forecast providers in the same manner. As mentioned previously, differences were not statistically evaluated for their significance. This is a small data set and hopefully any differences will be interpreted with that in mind. Despite the above reservations, the following conclusions can be stated.
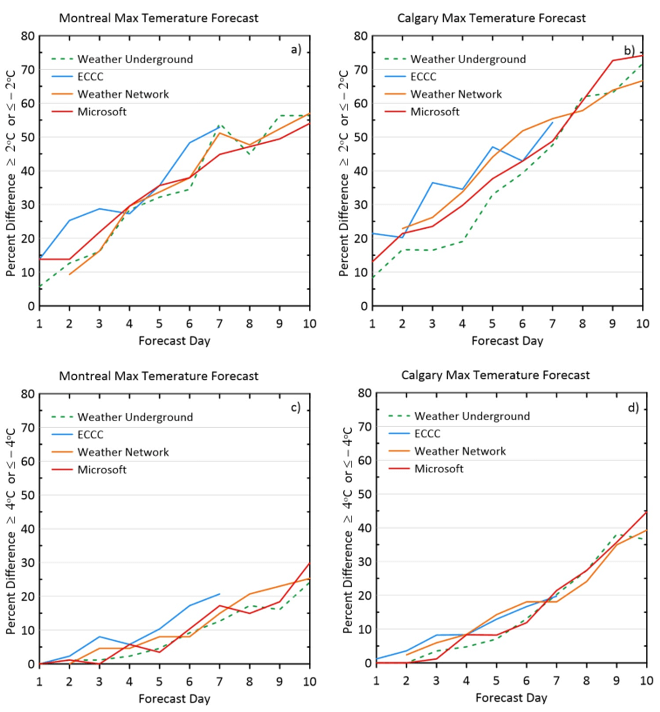
- The forecasts from the four providers are reasonably similar and provide useful information out to 7-10 days. This is best illustrated in Fig. 3 which looks at Montreal and Calgary which seem to be forecasting for the airport location. Shown are the differences between forecast and observations greater than plus or minus 2oC and 4o It would have been interesting to examine forecasts made out to longer periods, such as 14 days, but that is left for future studies.
- The maximum temperature forecast errors generally increase with forecast lead time, which is logical.
- The forecast providers do not explain how they produce the forecasts or indicate levels of expected accuracy. Although, there is obviously a need to keep intellectual property secure, the user would benefit by some explanations, such as the resolution of the models used.
- The exact location for the forecast is not given. Numerical weather prediction models are now running at resolutions of several kilometers, so simply indicating one value for a large city like Toronto is potentially giving misleading information.
- Users will have their own favourite forecast providers. Indeed, there is a wide range of presentations of the information which will appeal to different users. However, given the differences between forecast providers, users should probably get information from several sources rather than rely specifically on one.
- The ECCC weather warnings are copied by the other providers such as Microsoft, Weather Network, and Weather Underground. Although not stated, this could be to avoid possible legal actions for poor forecasts, or to make sure that users are aware of existing government alerts. However, there are times when the other forecast providers will not agree with the ECCC forecasts. It is not known how, or indeed if, this is managed when alerts or warnings are involved.
Studies such as this could benefit developers of improved forecasting techniques. It is assumed all of the forecast providers do their own verification studies, but they are generally hard to find, and are not done by independent groups. Independent reviews are available for almost all products including cars, food, insurance, medications, appliances, computers, software, etc. Given the importance of weather information, more independent intercomparison studies should be done. Hopefully, this article will provide motivation for future work. Finally, this study shows that forecasts of maximum temperatures are not exact, and any user must evaluate what that means to them.
Acknowledgements
Environment and Climate Change Canada (ECCC), MSN Weather (Microsoft), Weather Underground, and the Weather Network, who provided public weather information for this study, are gratefully acknowledged. They provide a community service which is invaluable. Weather Impacts Consulting funded this study out of their resources. No financial or other types of assistance was provided by any of the four weather information providers. The data used in this study can be obtained, without restrictions, by corresponding with the author.
George Isaac retired in 2013 as a Senior Scientist from ECCC after 40+ years of service. He formed a small company, Weather Impacts Consulting, and has continued doing research. He is also active as an Adjunct Professor at York University and Dalhousie University with their Atmospheric Science groups. Current projects include studying aircraft in-flight icing, better methods for using weather radar data, fog/visibility forecasting, impacts of clouds on climate, and methods to improve weather forecasting in general.
References
Stuart, A., G. Menger, M. Bredin, J. Capizzano, D. Cardish, E. Gately, S. Montone‐Fava, R. Nagar & G. Saville (1983) Verification of Toronto temperature and precipitation forecasts for the period 1960–1979, Atmosphere-Ocean, 21:3, 243-262, DOI: 10.1080/07055900.1983.9649167
Isaac, G. A., M, Bailey, F. S. Boudala, W. R. Burrows, S. G. Cober, R. W. Crawford, N. Donaldson, I. Gultepe, B. Hansen, I. Heckman, L. X Huang, A. Ling, J. Mailhot, J. A. Milbrandt, J. Reid, and M. Fournier, 2014a: The Canadian airport nowcasting system (CAN-Now). Meteorol. Appl. 21, 30–49, (DOI: 10.1002/met.1342).
Isaac, G.A., P. Joe, J. Mailhot, M. Bailey, S. Bélair, F.S. Boudala, M. Brugman, E. Campos, R.L.Carpenter Jr., R.W.Crawford, S.G. Cober, B. Denis, C. Doyle, H.D. Reeves, I.Gultepe, T. Haiden, I. Heckman, L.X. Huang, J.A. Milbrandt, R. Mo, R.M. Rasmussen, T. Smith, R.E. Stewart, D. Wang and L.J. Wilson, 2014b: Science of Nowcasting Olympic Weather for Vancouver 2010 (SNOW-10): A World Weather Research Programme project. Pure Appl. Geophys. 171, 1–24, (DOI: 10.1007/s00024-012-0579-0).
Barrie, Calgary, ECCC, forecasts, George Isaac, Halifax, Montreal, temperature, Toronto, Vancouver